Lab 1 - Build your first Android App
Summary
In this lab, you get familiarized with PyCharm and Android Studio development environment. Using a simple step detector as an example, you will write and debug your code in Python first, and later in Android.
Downloads
Python
Install PyCharm to your computer. If you are on your personal computer, you can either use the community version or you may apply for the Educational license. Install Anaconda Python distribution. The Python 3.6 distribution is recommended and used in this tutorial. You can ignore this step if you already have other Python distribution that works for you.
Set up Python Interpreter in PyCharm.
-
Open PyCharm. Go to PyCharm
Settings -> Project. -
Under Project Interpreter, navigate to Anaconda python path on your computer:
/anaconda/bin/pythonon Mac orC:/Users/YourUserName/anaconda/bin/pythonon Windows. Click OK. Note this is for your own PC. -
On lab computers, you should link the intepreter to
C:/Program Files (x86)/Python36-32/python.exeif not already linked. Click on theGear Icon -> Add Local -> System Interpreter -> ...and navigate to the path. The lab computers are not using the Anaconda distribution, but have packages like numpy, matplotlib and scipy installed.
Create a new Project in PyCharm.
-
Go to File -> New Project or Create New Project from the PyCharm Welcome Screen.
-
Pick a Pure Python project. Make sure the Interpreter is set to the Anaconda distribution.
-
Name your project
lab1(or a name you prefer). Click OK. -
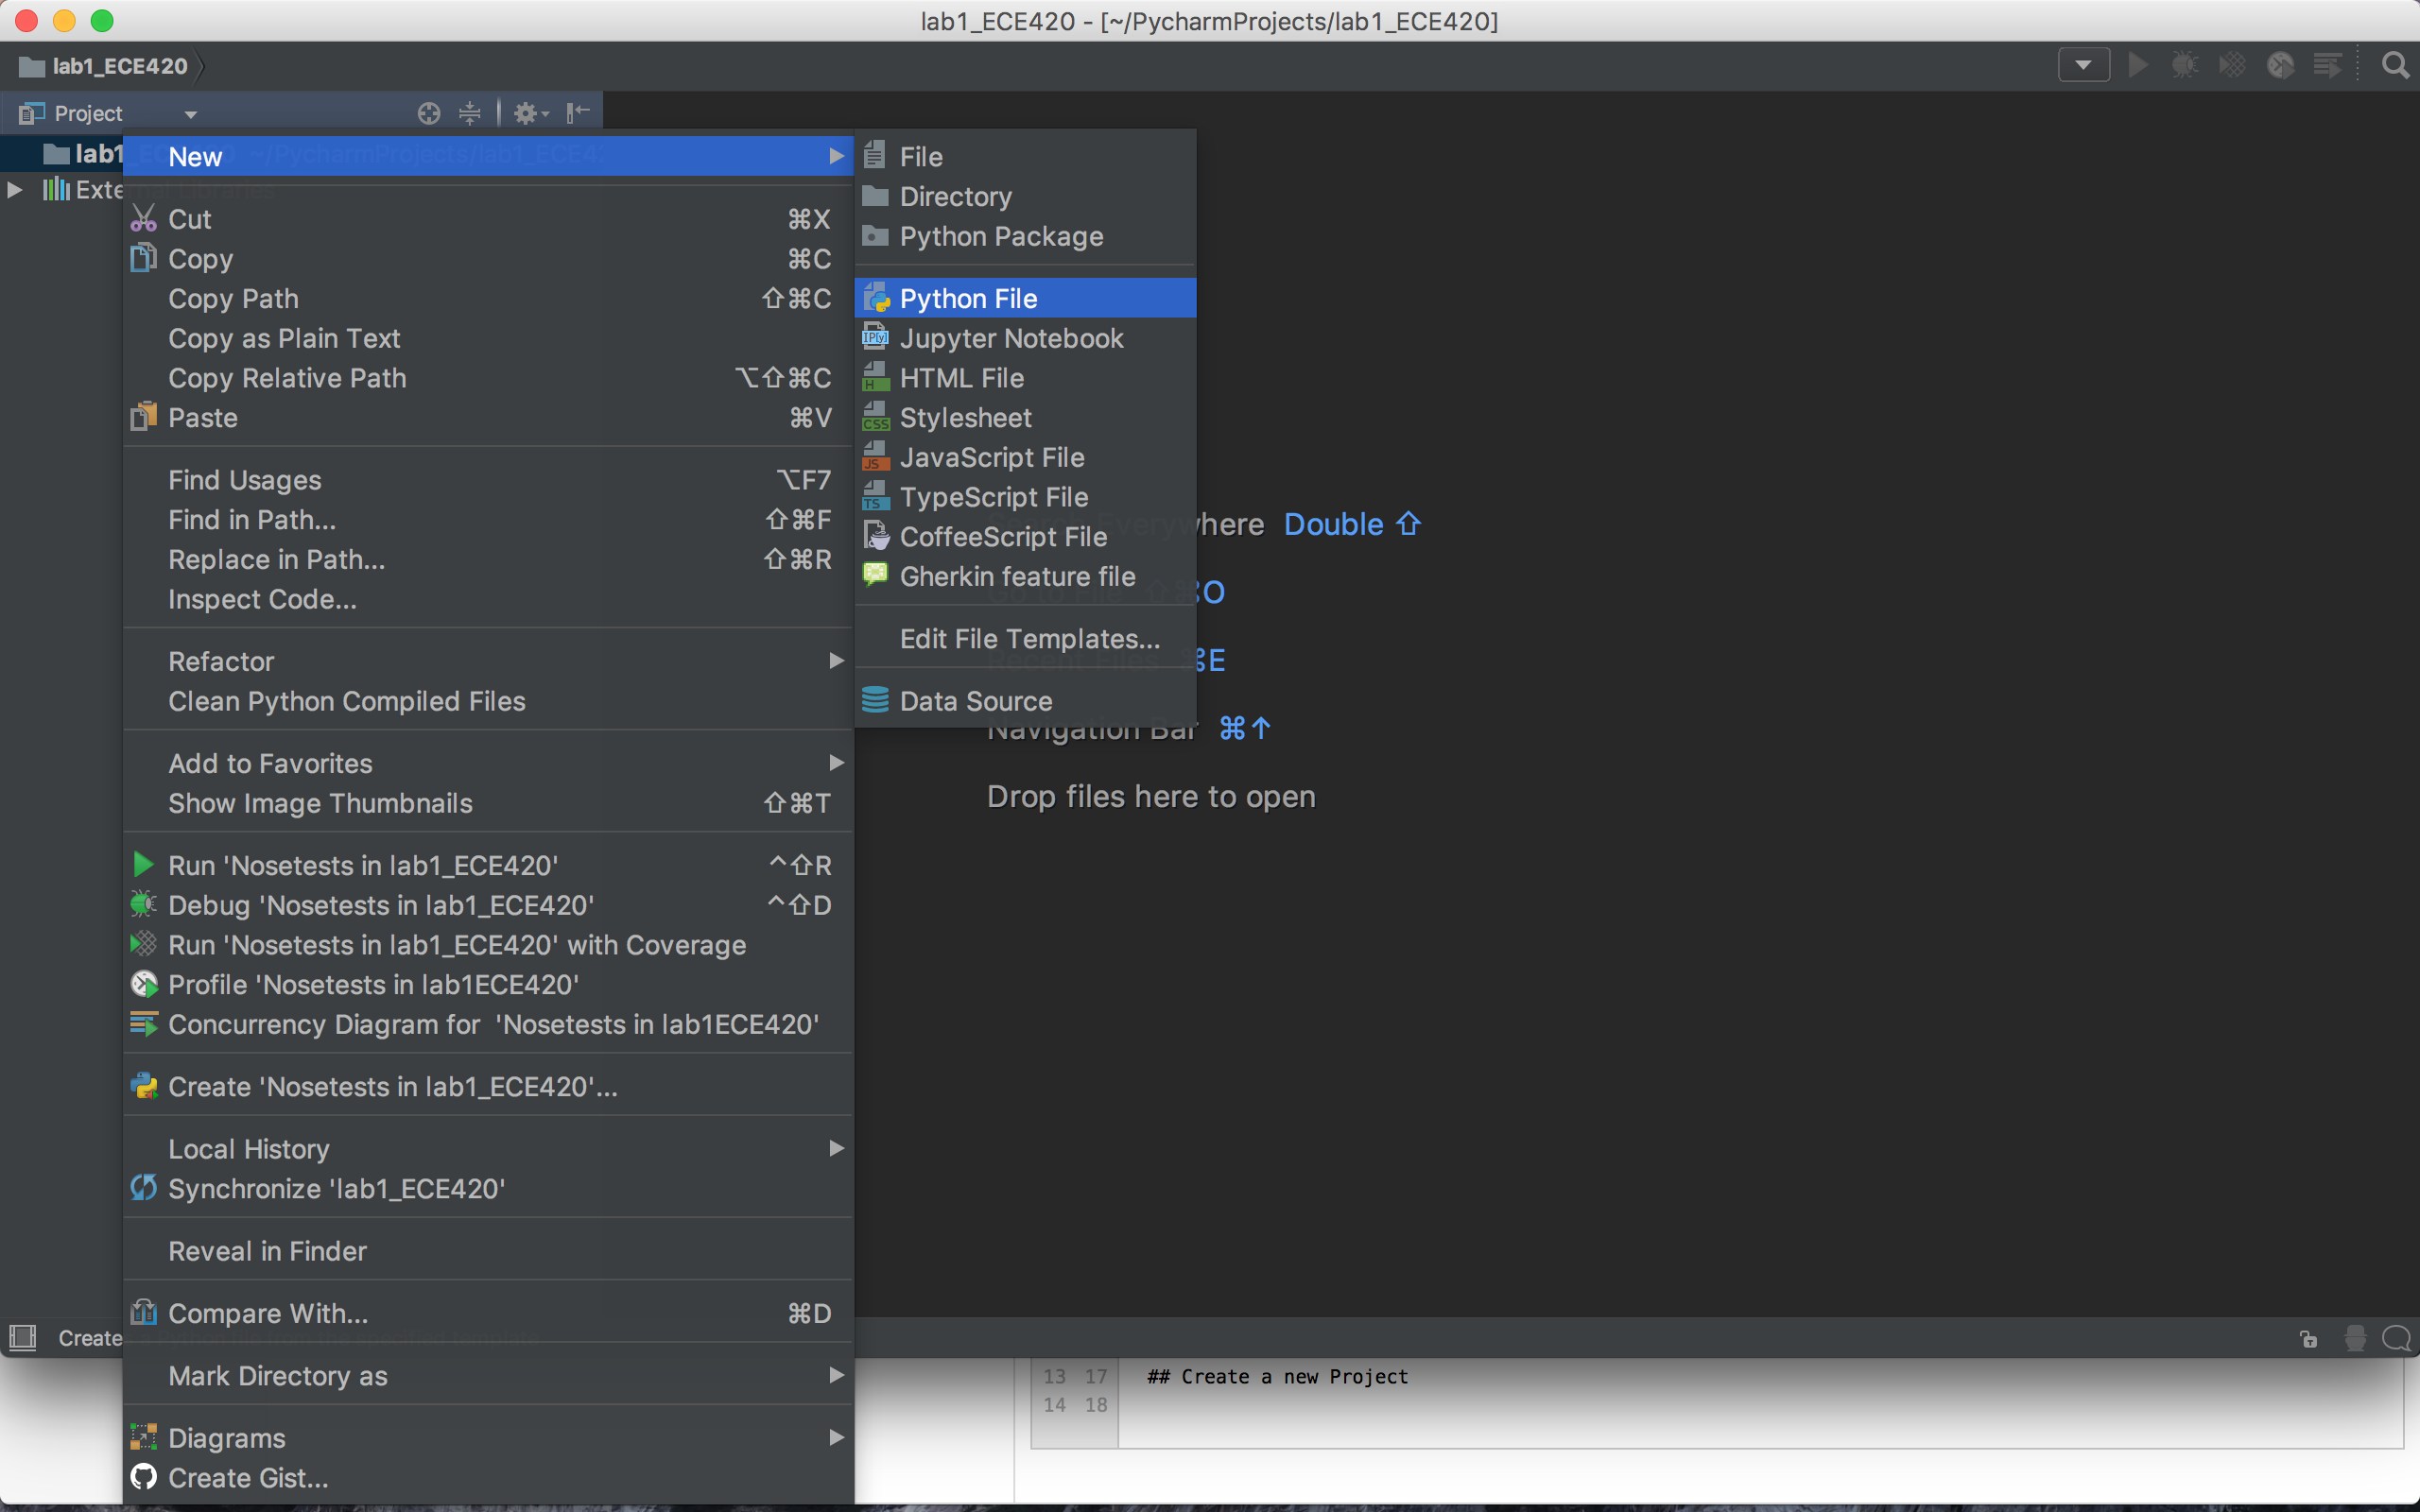
Right click the lab1 Navigation bar. Choose New -> Python File. Name it
peak_detection.py. Click OK.
Plot the sensor data
We generated sample sensor data in the file sample_sensor_data.csv, this file contains more than 3000 data samples collected from IMU sensor. Copy sample_sensor_data.csv to your lab1 folder.
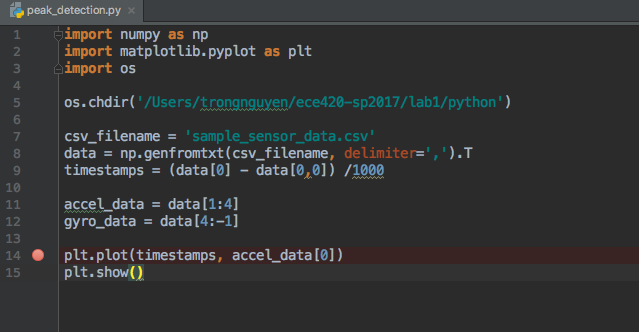
In the file peak_detection.py, type the following code (you may ignore line number 5, it changes the python working directory to your desired repository):
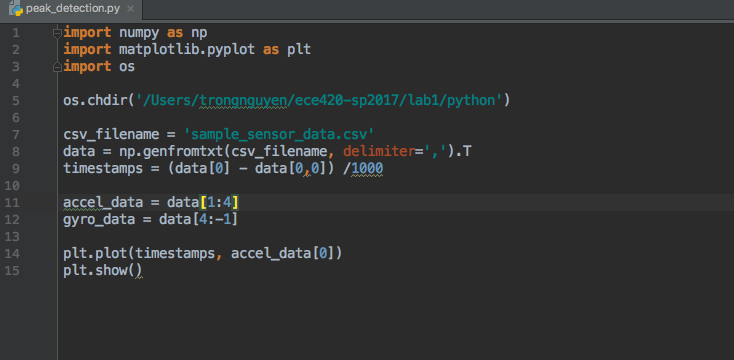
We imported the necessary libraries (numpy, matplotlib and os) from lines 1 to 3. If your csv file is not in the lab1 folder, you can use os.chdir() to navigate to the correct path like in line 5.
The accelerometer and gyroscope data are extracted in line 11 and 12. The time vector is extracted in line 9. Let's plot the first axis of accelerometer data in line 14 and 15.
Run your program
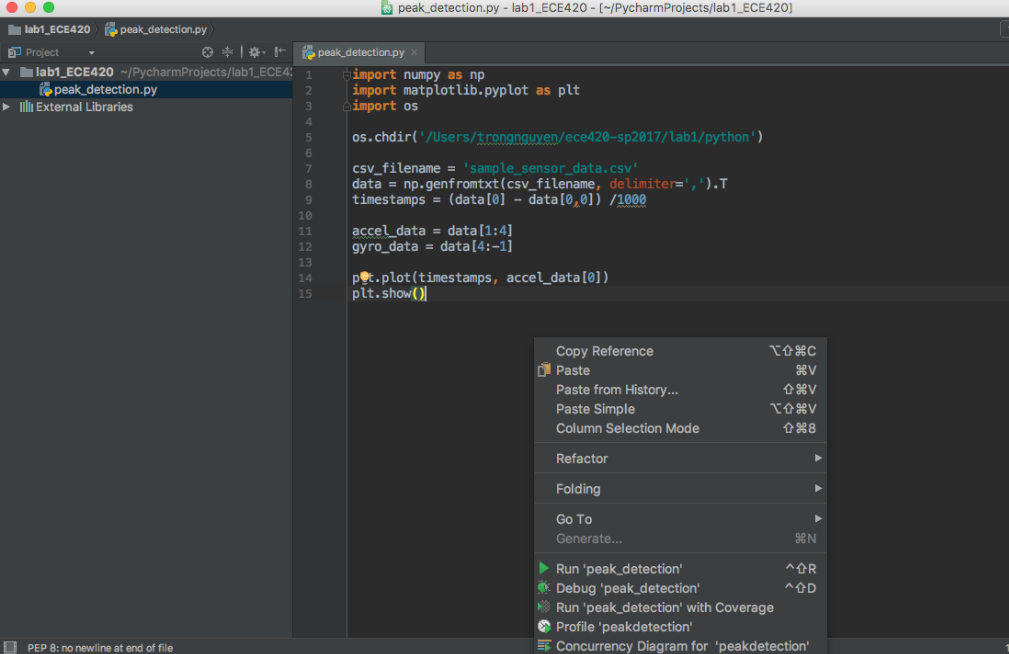
Right click anywhere inside the code page and choose Run 'peak_detection'.
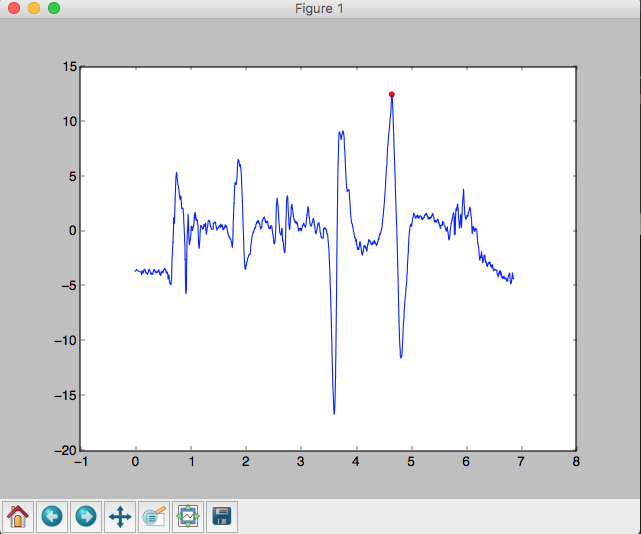
The plot is as follows:
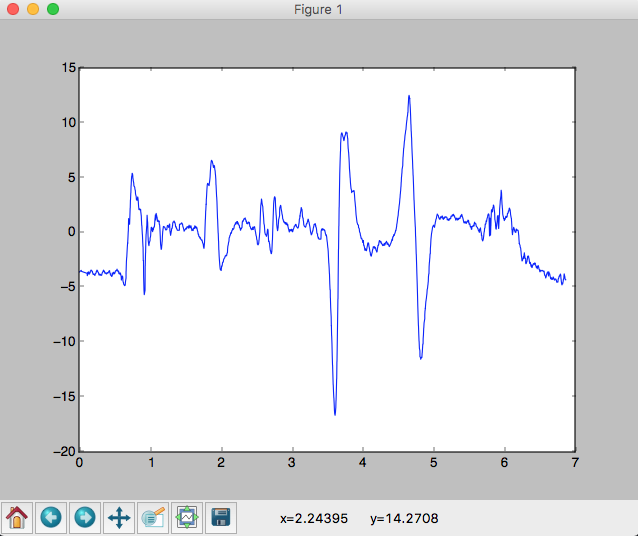
Close the figure to stop the program from running.
Debug your code
Click on the space between the code the the line number on line 14 to set a break point (red circle).
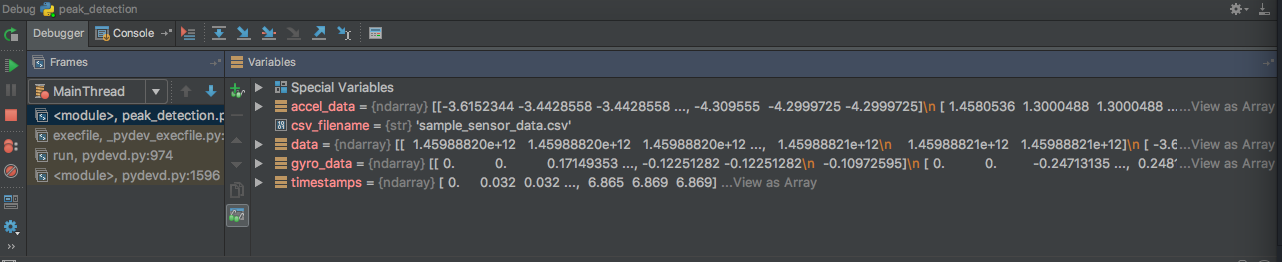
Right click inside the peak_detection.py or click on the Debug button on the top right corner of PyCharm (the bug symbol). The execution will stop at line 14.
In the Debug console, you can view all the variables currently created. If it is a numpy array, you can click on View as Array (at the end of the row) to view it as a table.
Debug in the IPython Console
While in the Debug mode, you can write code on the fly to test out your logic. Switch to the Console tab and choose Show Python Prompt (where the red arrow points to)
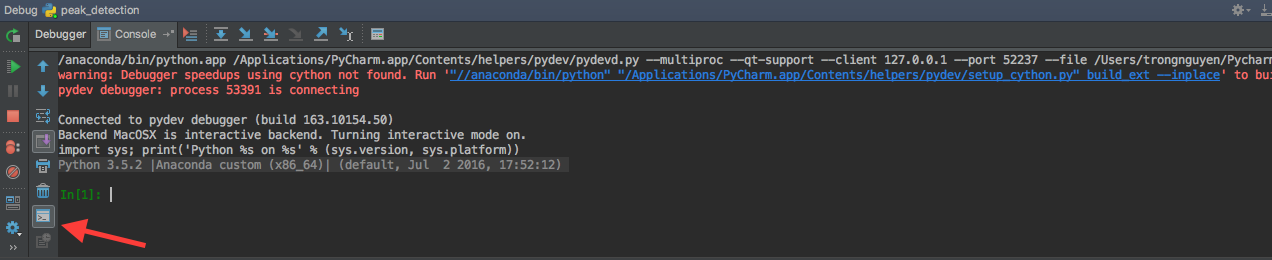
This is the python interactive console connected to your debugger. For example, let's find the maximum value of the accelerometer data in the console. Type accel_data[0].max() in the console and press enter. It should give a value of 12.507.
More info on how to step through your program here.
Define your function
Now let's define a function to find a peak in your signal. Go to the top of the function and define a function peak_detection on line 4. Please type the following lines:
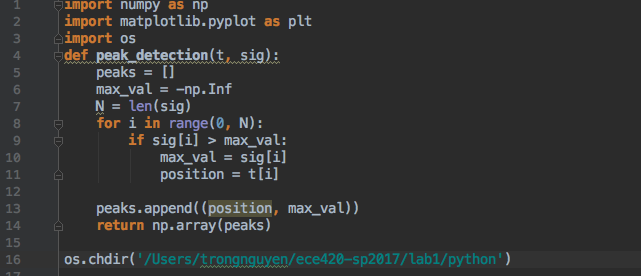
The function accepts the time array t and the accelerometer data array sig.
We define a Python list of peaks on line 5. For now we detect a single peak, the maximum value of our signal. We use a for loop (line 8) to traverse through the our array sig. Initially, the max_val is set to minus infinity (why?). Every time we encounter a greater value than max_val (line 9), we record this value and its time position (line 10 and 11).
Python Syntax
Python relies on indentation to differentiate different parts of the code.
The position and the maximum value are appended to the list of peaks in line 13. In line 14, we turn our list to numpy array for plotting and return it to the calling function.
Now that we define our function, we can call it and plot our peak. Add this line before the plot function:
1 |
max_peaks = peak_detection(timestamps, accel_data[0]) |
Add this line of code after the plot function (line 14).
1 |
plt.scatter(max_peaks[:,0], max_peaks[:,1], color = 'red') |
Question
What is the dimension of max_peaks?
Now run or debug your program. You should see a red peak overlaid onto the signal.
Assignment 1
Copy and run the above code so that you too can display the maximum value of the provided accelerometer data.
Give your plot a title of "First axis of accelerometer data". Name your x-axis "Time" and your y-axis "Meters per second".
Show your TA when done and save the figure. This assignment is worth 1 point.
Assignment 2
Modify the peak_detection function to detect other peaks in the signal. Add the new peaks and time positions to our peaks list. The function should accept a new input parameter thresh (peaks should have value greater than thresh). Plot all the peaks you detected, title the figure and label the axis accordingly.
Refer to the submission guidlines when finished.
Here is a sample output with thresh = 3 (Your figure don't have to be exatcly the same with this example one).
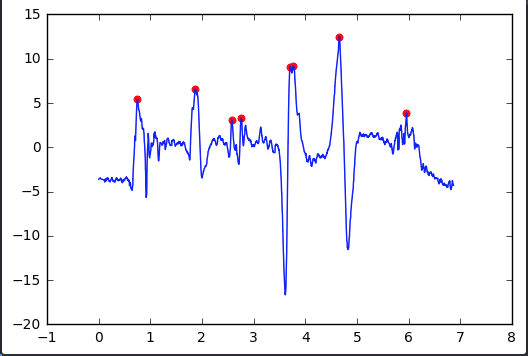
This assignment worth 1 point.
Android
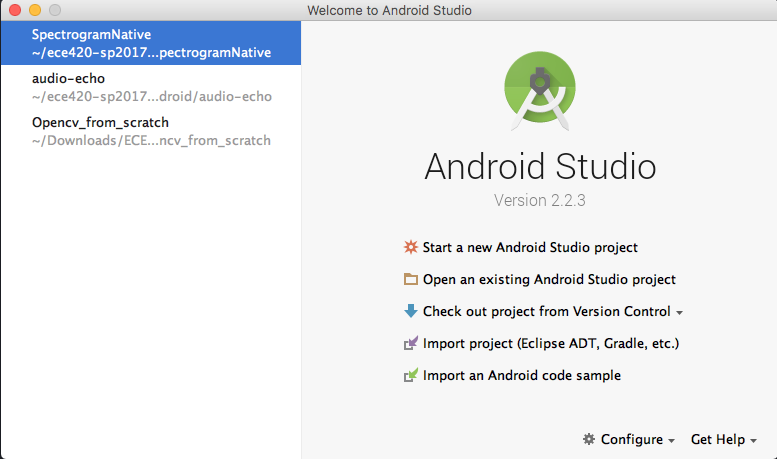
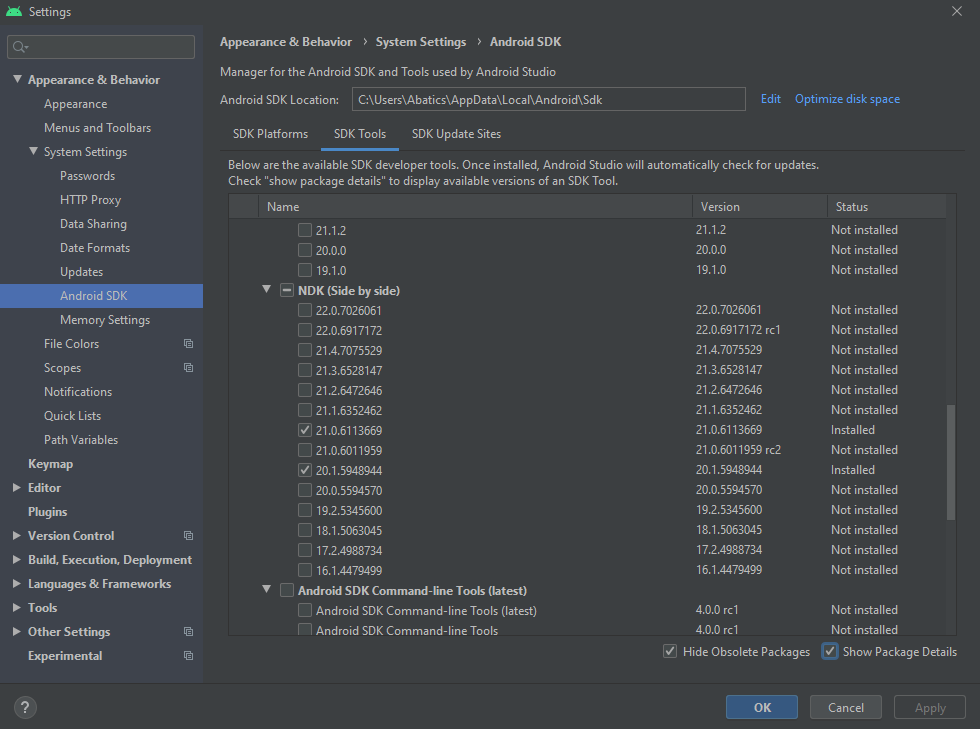
Download and install Android Studio. On the Welcome Screen, click Configure -> SDK Manager.
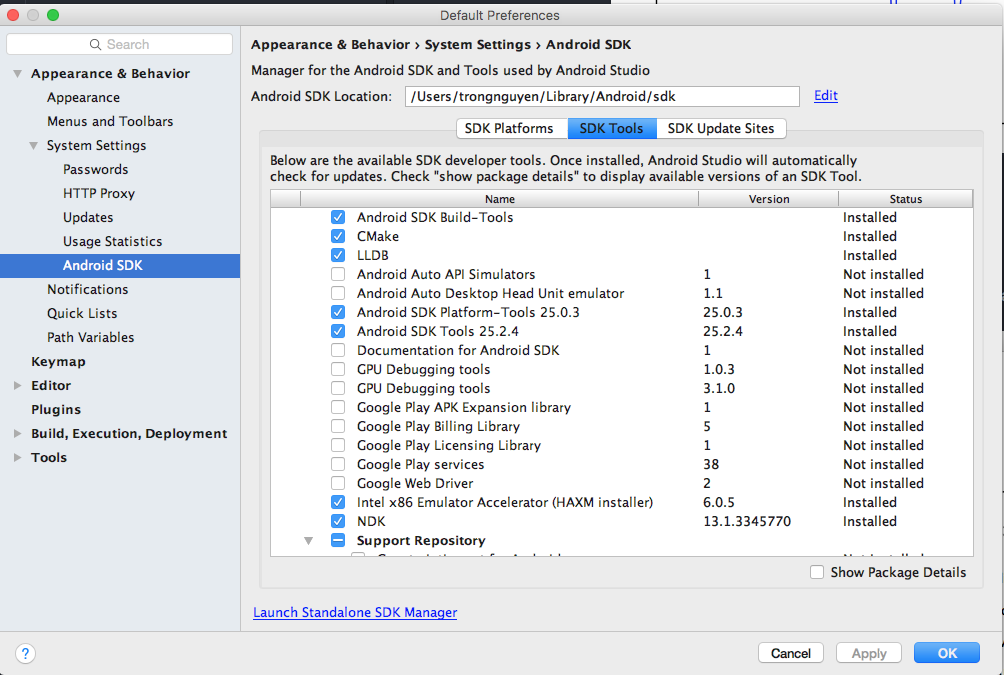
Switch to tab SDK tools, and check the boxes as in the figure below. These will install the requisite Java SDK, C++ NDK, and debugging tools. Click OK to install.
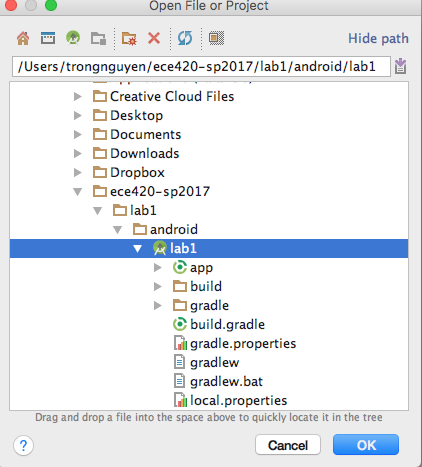
Choose Open an existing Android Project or Import Project. Navigate to the lab1 project. It might take a few seconds for Android Studio to index the files and configurations.
Explore the Project
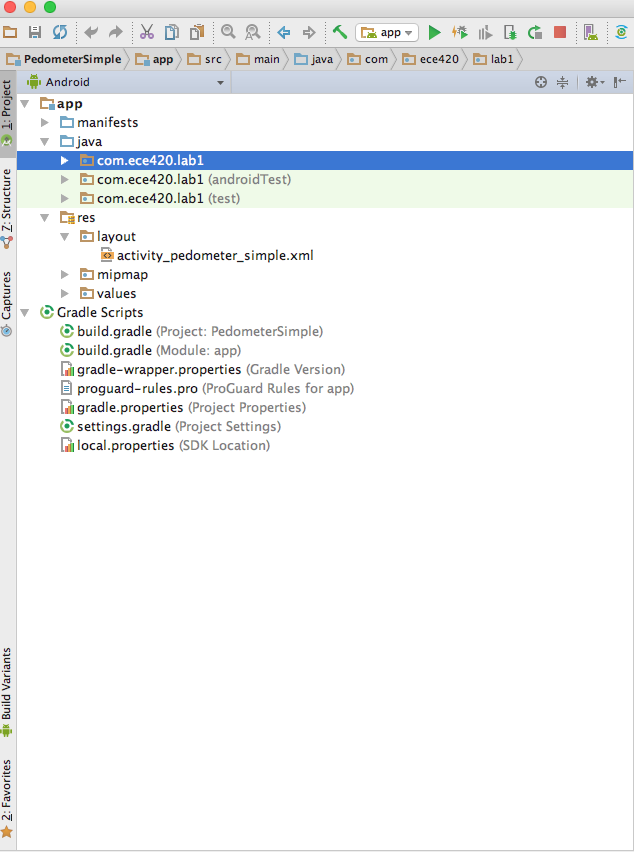
Choose the Android tab from the Project Sidebar. Expand the java and res folder. Double click on the activity_pedometer_simple.xml in the res/layout folder.
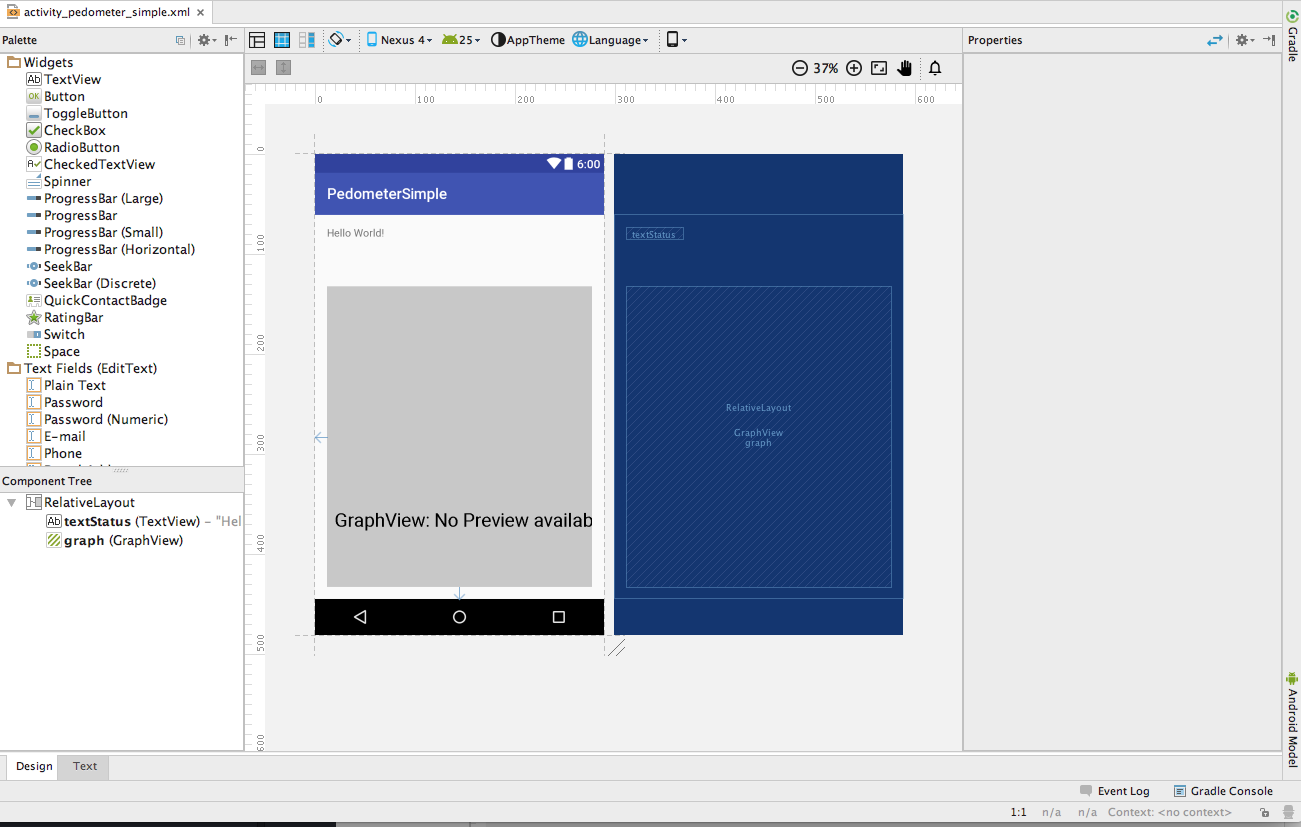
Our user interface consists of a label which says "Hello world!" and a GraphView to display our pedometer signal. Click on the text label, in the popped out Properties tool bar, change the text from "Hello World!" to "Steps Detected". Save your changes.
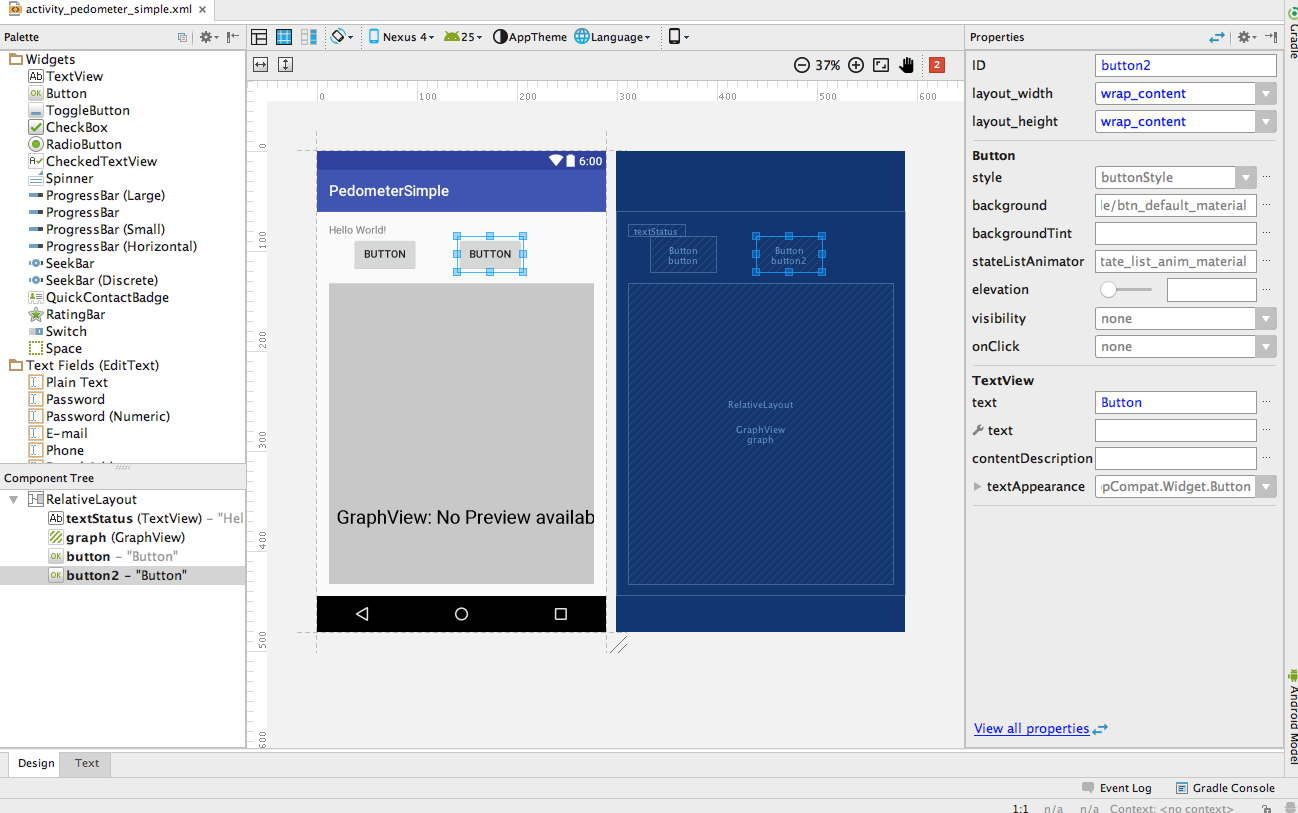
Drag two buttons from the Widgets in the Palette View on the left side into our PedometerSimple layout.
Switch to the Text view (at the bottom left, next to Design tab) to edit the layout of our user interface in .xml.
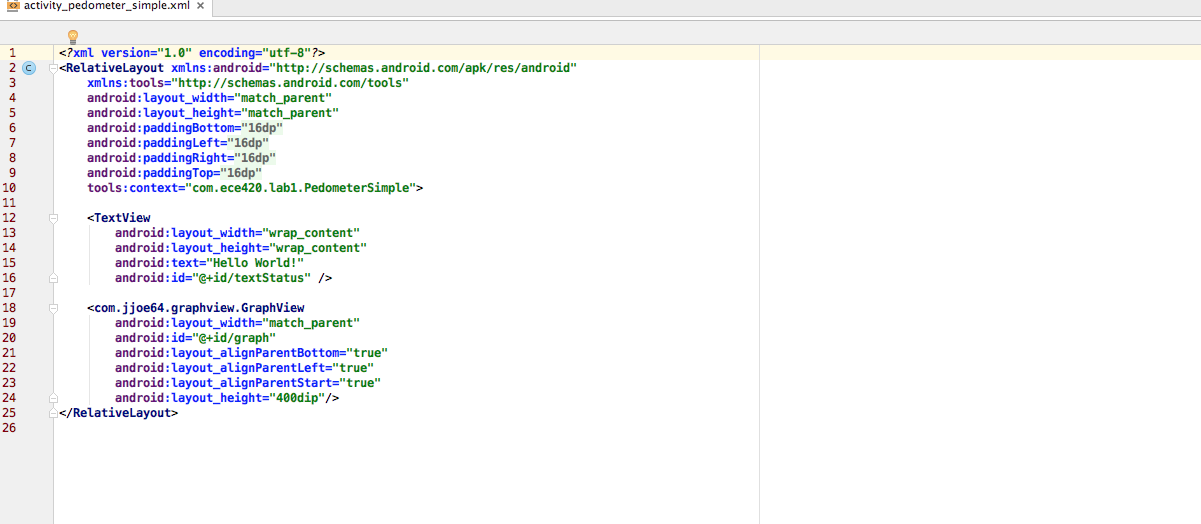
The above .xml view is before the buttons are added.
- Right click on the line
android:id="@+id/button"and modify it toandroid:id="@+id/buttonStart". Notice this will assignbuttonStartas the button id and resolve the red error in the following line ofPedometerSimple.java
1 |
buttonStart = (Button) findViewById(R.id.buttonStart); |
-
Change the text of the Buttons to
"Start!"and"Stop!"(in the android:text properties). And change theandroid:id="@+id/button"of the Stop Button toandroid:id="@+id/buttonStop". -
Save the .xml file and switch back the Design View to see your new design.
Button event listener
Navigate to java folder. Expand com.ece420.lab1 and open PedometerSimple.java.
A TextView named textStatus and a Button named buttonStart are declared by the following lines:
1 2 |
public TextView textStatus; private Button buttonStart; |
. We connect those two variables to the user interface components in the following lines:
1 2 |
textStatus = (TextView) findViewById(R.id.textStatus); buttonStart = (Button) findViewById(R.id.buttonStart); |
When you press the Start Button, the code from the following lines will run.
1 2 3 4 5 6 7 8 9 10 11 |
buttonStart.setOnClickListener(new View.OnClickListener() { @Override public void onClick(View v) { if (!sensorsOn) { sensorsOn = mSensorReader.startCollection(); if (sensorsOn) { textStatus.setText("Started!"); } } } }); |
These are event handlers for the button click event. We start our IMU sensor data collection using the SensorReader.startCollection() function and change the label textStatus to "Started".
Assignment 3
Create a variable named buttonStop (of class Button) and connect this variable to the buttonStop UI element by using the function findViewById, similar to buttonStart
Under the buttonStart.setOnClickListener() event handler, write the event handler for the buttonStop click event as follows:
If the sensorsOn variable is true, set it to false and call the StopCollection() function on the mSensorReader class instance. Also set the textStatus label to "Stopped!".
This assignment worth 2 points.
Question
What do onResume() and onPause() function do?
Please ask your TA to check your answers before continuing the next part.
Developer mode on the tablet.
Before you do any Android development or run any of our labs, you need to enable the developer mode on your Android device.
From the home screen of your tablet, swipe down twice and choose the Settings icon. Scroll down to the About Tablet setting. Inside the About Tablet setting, find the Build Number item. Tap it 7 times, and there will be notifications informing that you are now a developer.
Go back to the main Settings menu, and choose the Developer options. Turn on the USB debugging. Connect your tablet to your computer via USB. Say yes to the rsa-fingerprint notification.
If you are on Windows, you may need to install the OEM USB Drivers for your device. See this page for help if your device is not automatically recognized.
Run the step detector app
Go to the Run menu and choose Run app. This will handle building the Android target and uploading the APK to the device.
Choose the right tablet when the Select Deployment Target screen appears.
Debugging your app
Android Studio has multiple ways to step through code.
Switch to the Android Monitor tab. You can see the output of the Log.d() function in this window. Android's Log function is a useful tool for debugging and monitoring your app.
Miscellaneous - NDK Build Error Fix
You could encounter twith the NDK build error (null pointer, gradle errors, etc.) Here's what you can do to fix it.
Make sure 21.0.6113669 is installed (it might work with other versions, this is simply the one Francis had which worked).
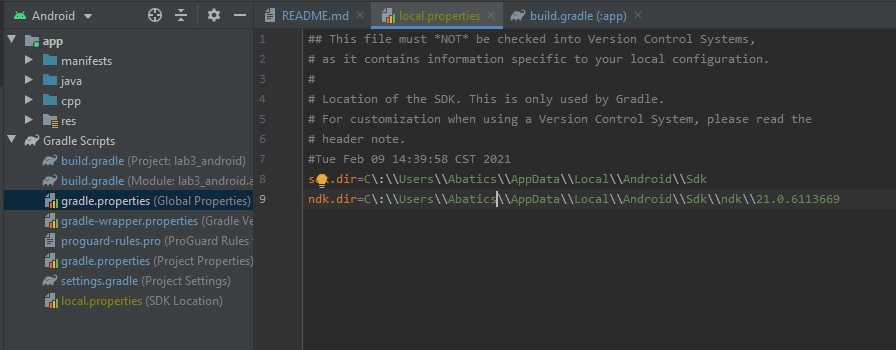
Go to gradle.properties ( local.properties ) under Gradle Scripts. Add the "ndk.dir" line that is above, with where your NDK is downloaded and with your version. For example, if you install in default location, you only would have to change the things I have in caps:
ndk.dir=C\:\\Users\\USER_NAME\\AppData\\Local\\Android\\Sdk\\ndk\\VERSION_NUMBER
If you're on Mac, your backslashes might be forwards slashes.
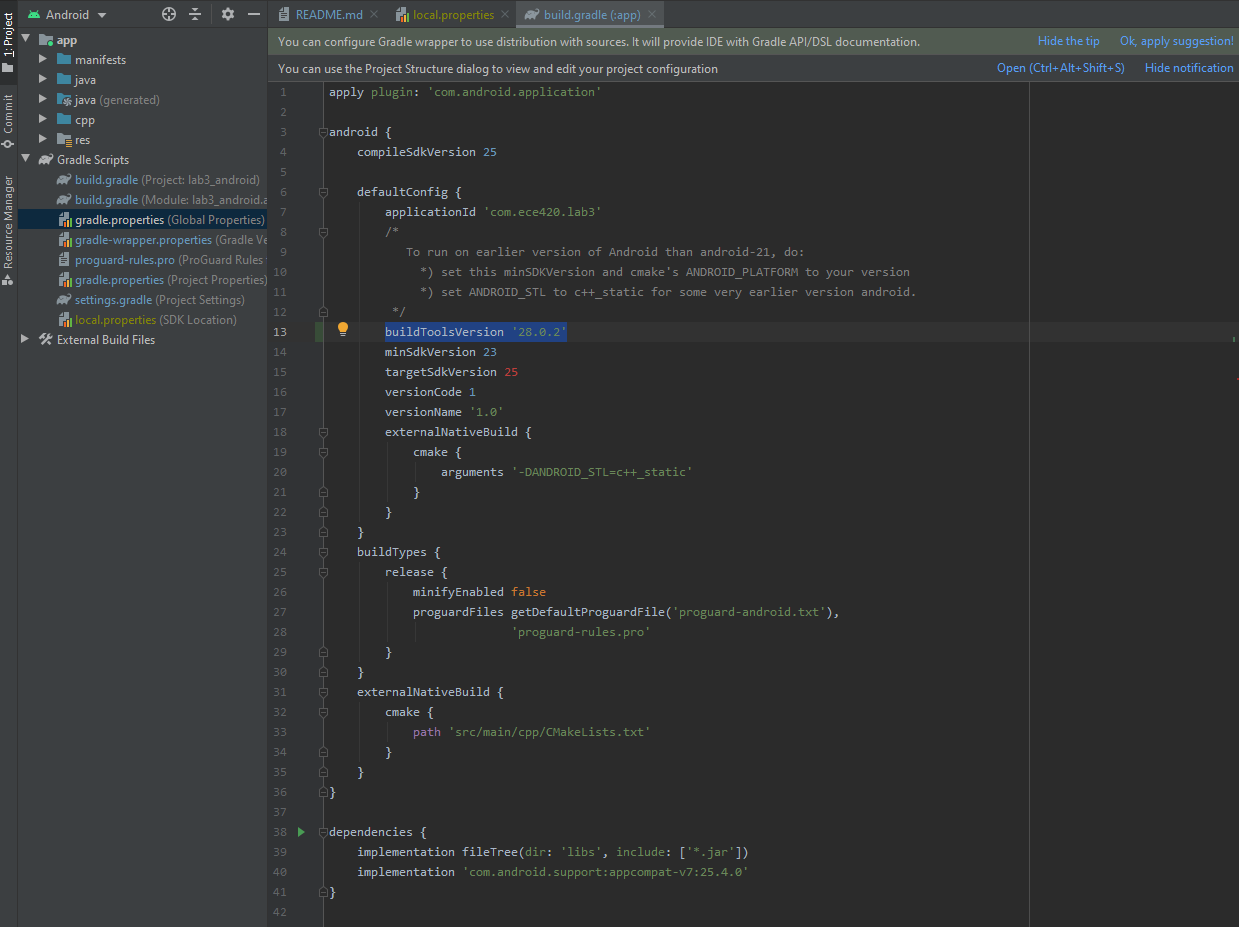
Make sure your build.gradle file under your app folder looks like this. You might need to add
buildToolsVersion '28.0.2'
on line 13.
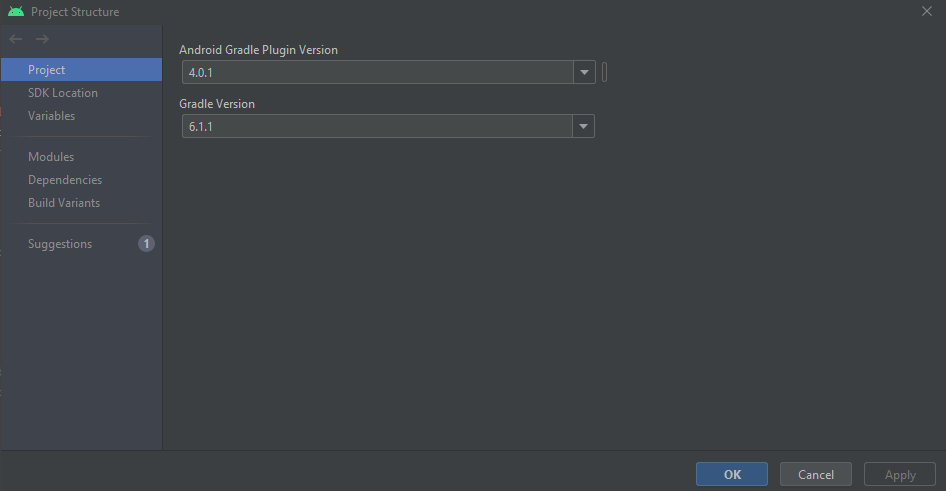
Under File->Project structure, you might need to change the Android Gradle Plugin Version and Gradle Version to 4.0.1 and 6.1.1. Finally, under make, press "Sync project with gradle files"
Android Tutorial
For more tutorials on Android app development, please see this link Android App Tutorial.
Submission Instructions
Refer to the Submission Instruction page for more information.
Grading
Lab 1 will be graded as follows:
-
Prelab [N/A]
-
Lab [4 points]
-
Python:
-
Assignment 1 [1 point]
Max point detected figure [0.5 point]
Figure properly titled and labeled [0.5 point]
-
Assignment 2 [1 point]
Peaks detected figure [0.5 point]
Figure properly titled and labeled [0.5 point]
-
-
Android:
- Assignment 3 [2 point]
Proper text display of buttonStart [0.5 point]
Proper behavior of buttonStart [0.5 point]
Proper text display of buttonStop [0.5 point]
Proper behavior of buttonStop [0.5 point]
- Assignment 3 [2 point]
-
-
Quiz [2 points]