ECE 486 Control Systems
Lecture 18
Nyquist Stability Criterion
In this lecture, we will establish the frequency domain equivalent of Routh-Hurwitz stability criterion. We shall learn how to detect the presence of Right Half Plane poles of the closed loop transfer function as scalar gain \(K\) is varied using frequency response data.
Recall the standard unity negative feedback configuration as shown in Figure 1.

Figure 1: Unity feedback with scalar gain \(K\)
Our goal is to count the number of RHP poles (if any) of the closed loop transfer function
\[ \frac{Y}{R}(s) = \frac{KG(s)}{1+KG(s)} \]
based on frequency domain characteristics of the plant transfer function \(G(s)\).
Nyquist Plot
Consider an arbitrary strictly proper transfer function \(H(s)\) in zero-pole form.
\[ \tag{1} \label{d18_eq1} H(s) = \frac{(s-z_1) \cdots (s-z_m)}{(s-p_1) \cdots (s-p_n)},\, m < n. \]
By Nyquist plot, we mean a plot of \({\rm Im}\, H(j\omega)\) versus \({\rm Re}\, H(j\omega)\) as \(\omega\) varies from \(-\infty\) to \(\infty\) on the complex plane.
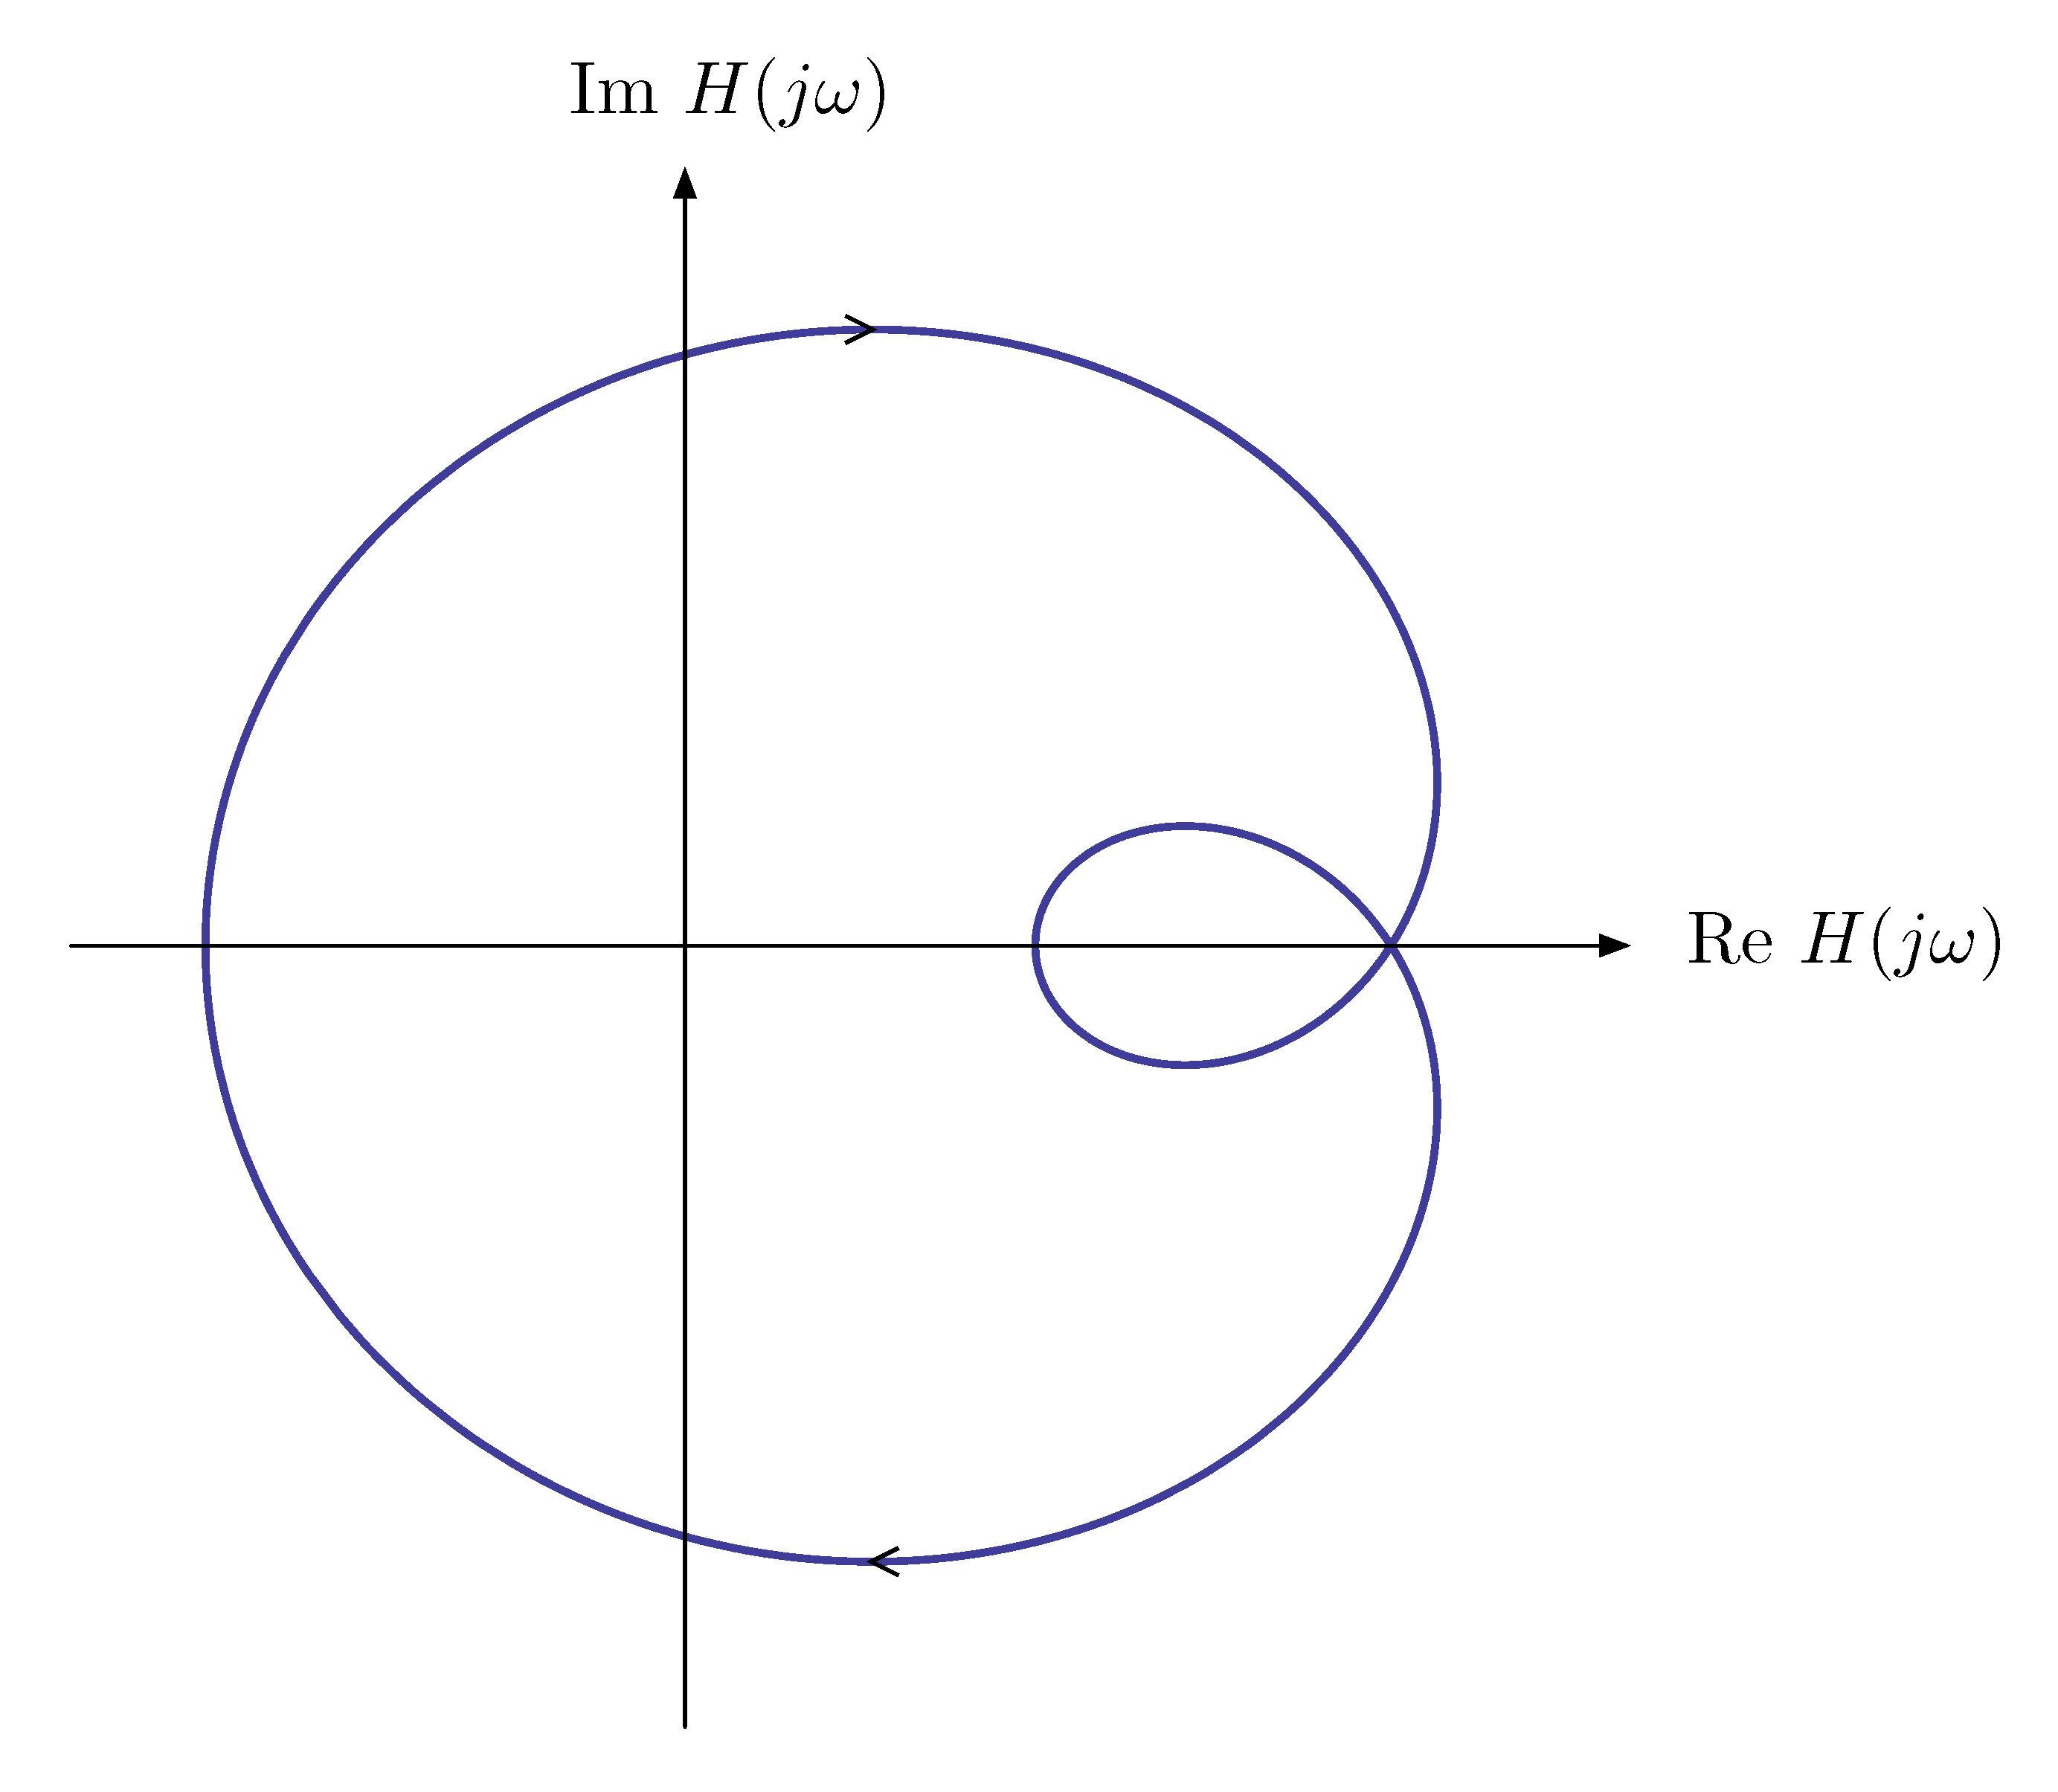
Figure 2: A sample Nyquist plot
Also we can view the Nyquist plot of \(H(j\omega)\) as the image of the imaginary axis \(\{ j\omega \in \CC : -\infty < \omega < \infty\}\) under the mapping \(H : \CC \to \CC\).
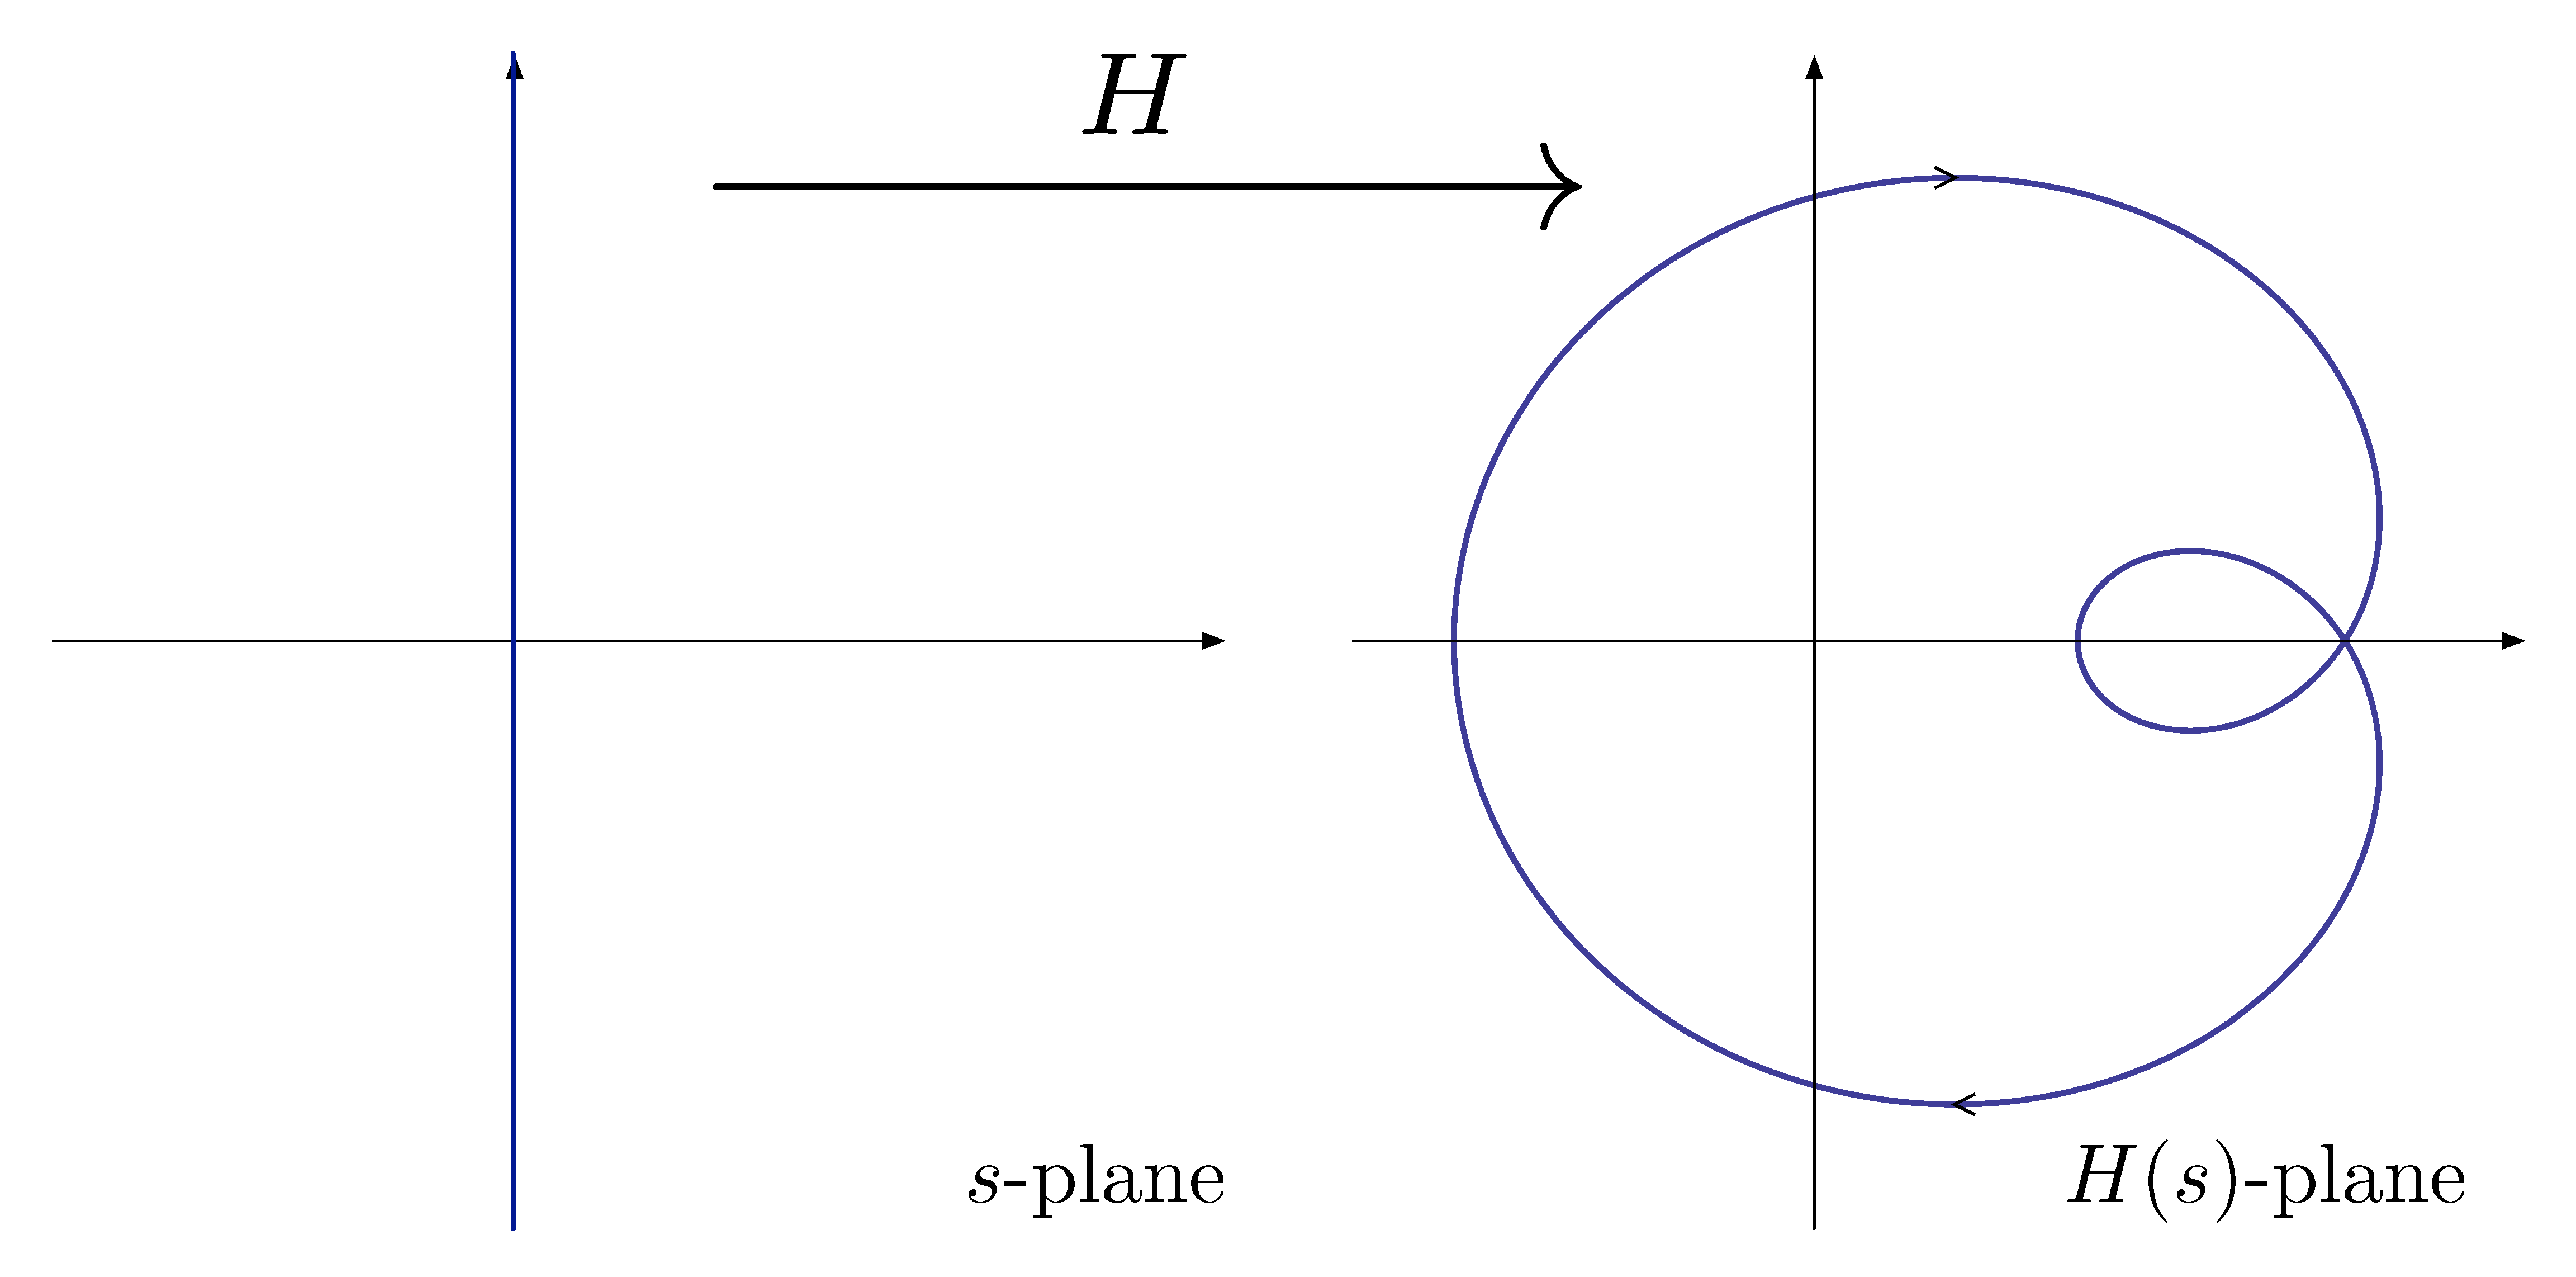
Figure 3: Nyquist plot as the image of imaginary axis under map \(H\) (in purple)
Similarly, if we consider any closed curve (or contour) \(C\) in the complex plane, \(C\) will get mapped by \(H\) to some other curve (another contour) in the image complex plane.
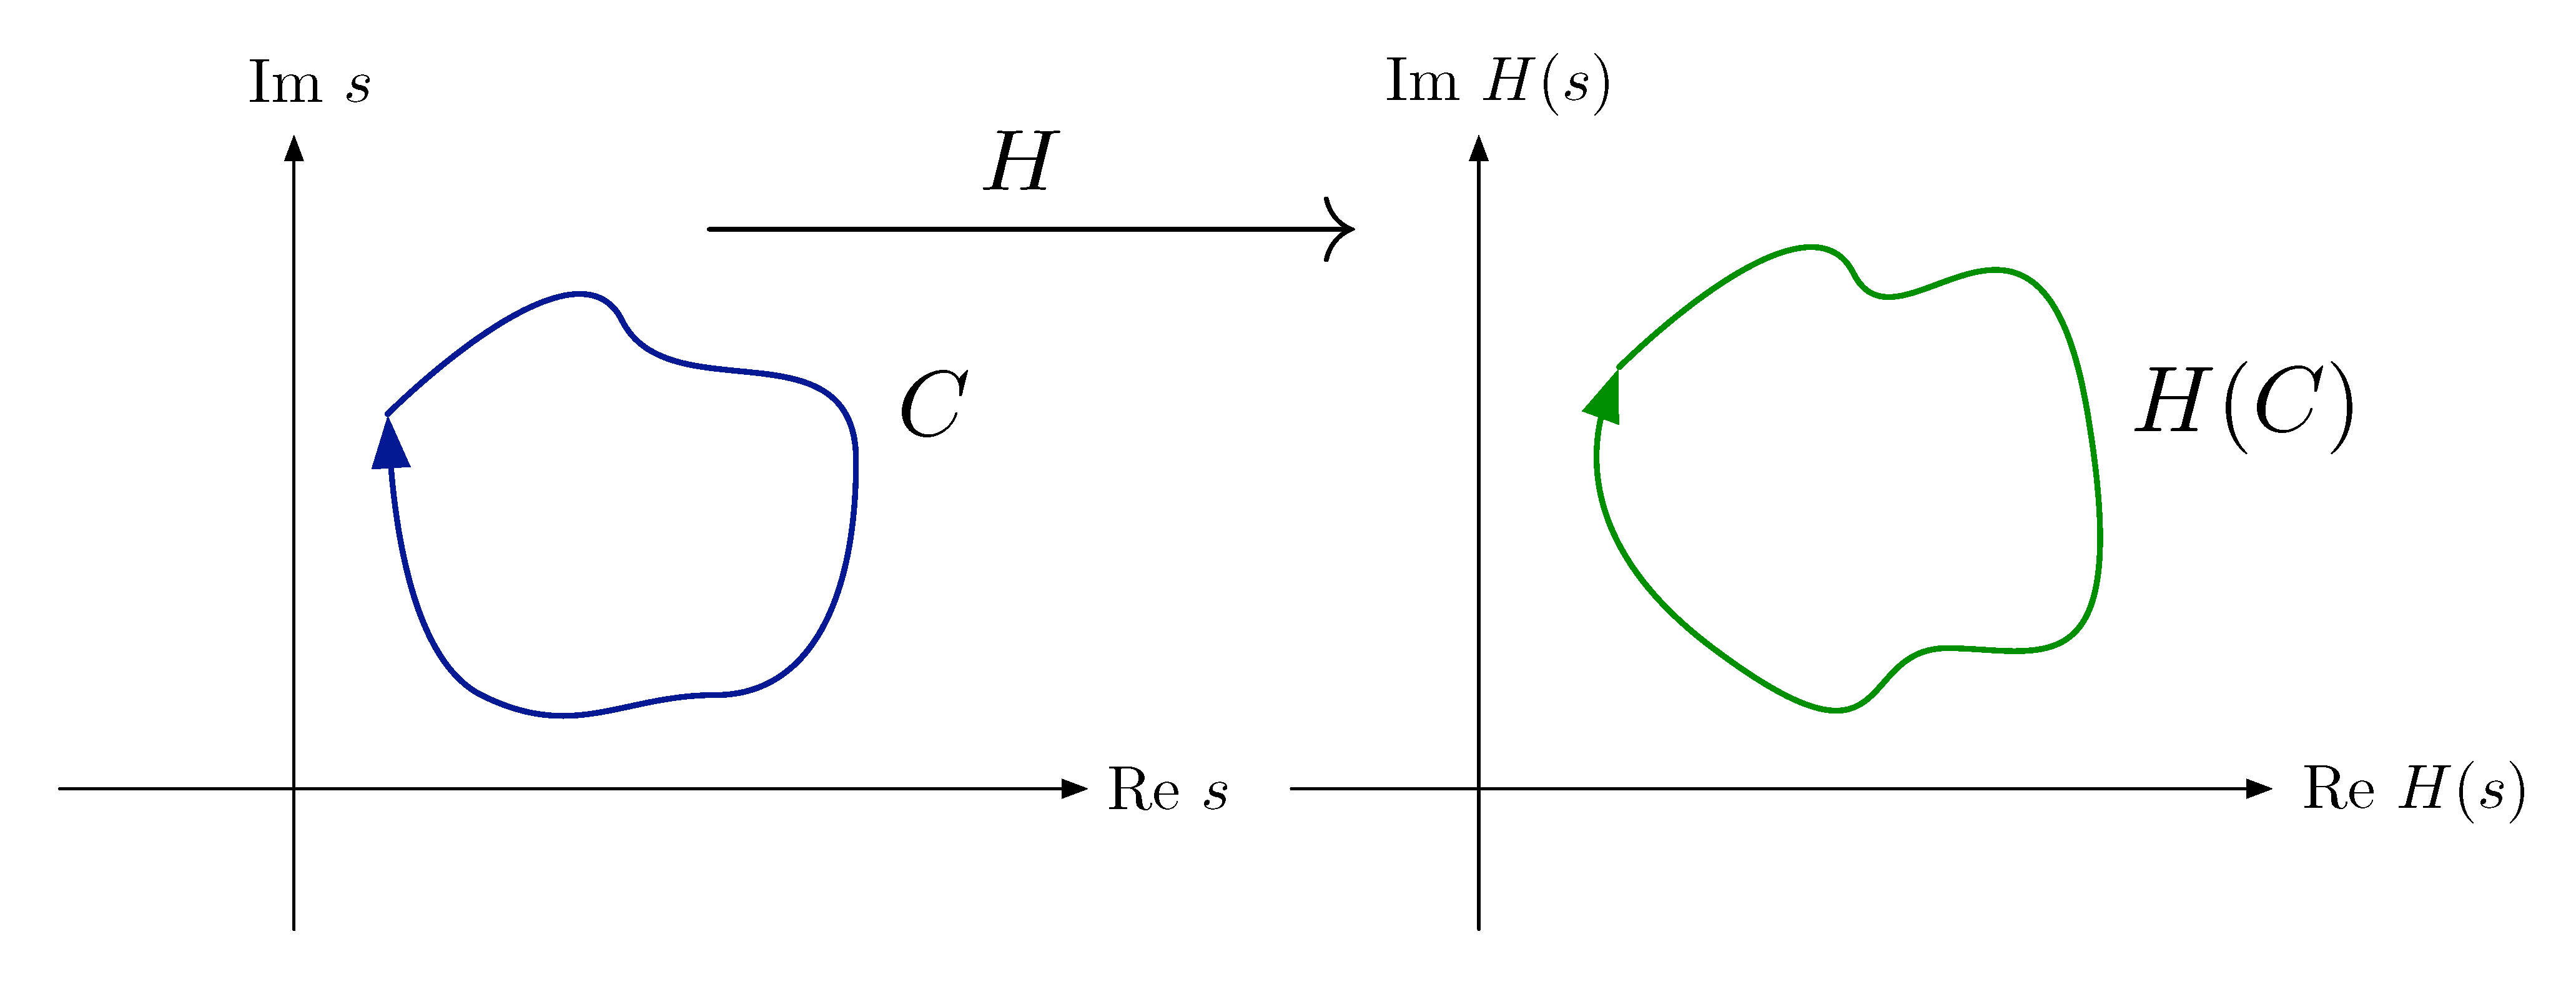
Figure 4: Map \(C\) to \(H(C)\) in the complex plane
Note when working with contours in the complex plane, we always keep track of the direction in which we traverse the contour, i.e., clockwise or counterclockwise.
Question: In Figure 4, why is the image contour \(H(C)\) of a clockwise contour \(C\) under \(H\) is also clockwise? When is this true?
Hint: This is due to the fact that the transfer function \(H(s)\) as a rational function is conformal (angle preserving). And if there is no poles of \(H(s)\) inside contour \(C\), then the orientation is also preserved.
The reason why we used zero-pole form in Equation \eqref{d18_eq1} for \(H(s)\) is that for any \(s \in \CC\), the phase (or argument) of \(H(s)\) can be conveniently computed as
\begin{align*} \angle H(s) &= \angle \frac{(s-z_1) \cdots (s-z_m)}{(s-p_1) \cdots (s-p_n)} \\ &= \sum^m_{i=1} \angle (s-z_i) - \sum^n_{j=1} \angle (s-p_j) \\ &= \sum^m_{i=1} \psi_i - \sum^n_{j=1} \varphi_j. \tag{2} \label{d18_eq2} \end{align*}We are interested in how \(\angle H(s)\) changes as \(s\) traverses a closed, clockwise (\(\circlearrowright\)) oriented contour \(C\) in the complex plane. (Why clockwise? Hint: It will be evident later that when we consider the contour that encloses the Right Half Plane, its component on the imaginary axis travels from \(-j\infty\) to \(+j\infty\).)
We will look into several cases, depending on how the contour is located relative to poles and zeros of \(H(s)\).
Case 1: Contour Encircles a Zero
Suppose that \(C\) is a closed, $\circlearrowright$-oriented contour in \(\CC\) that encircles a zero of \(H(s)\) as shown in Figure 5(a).
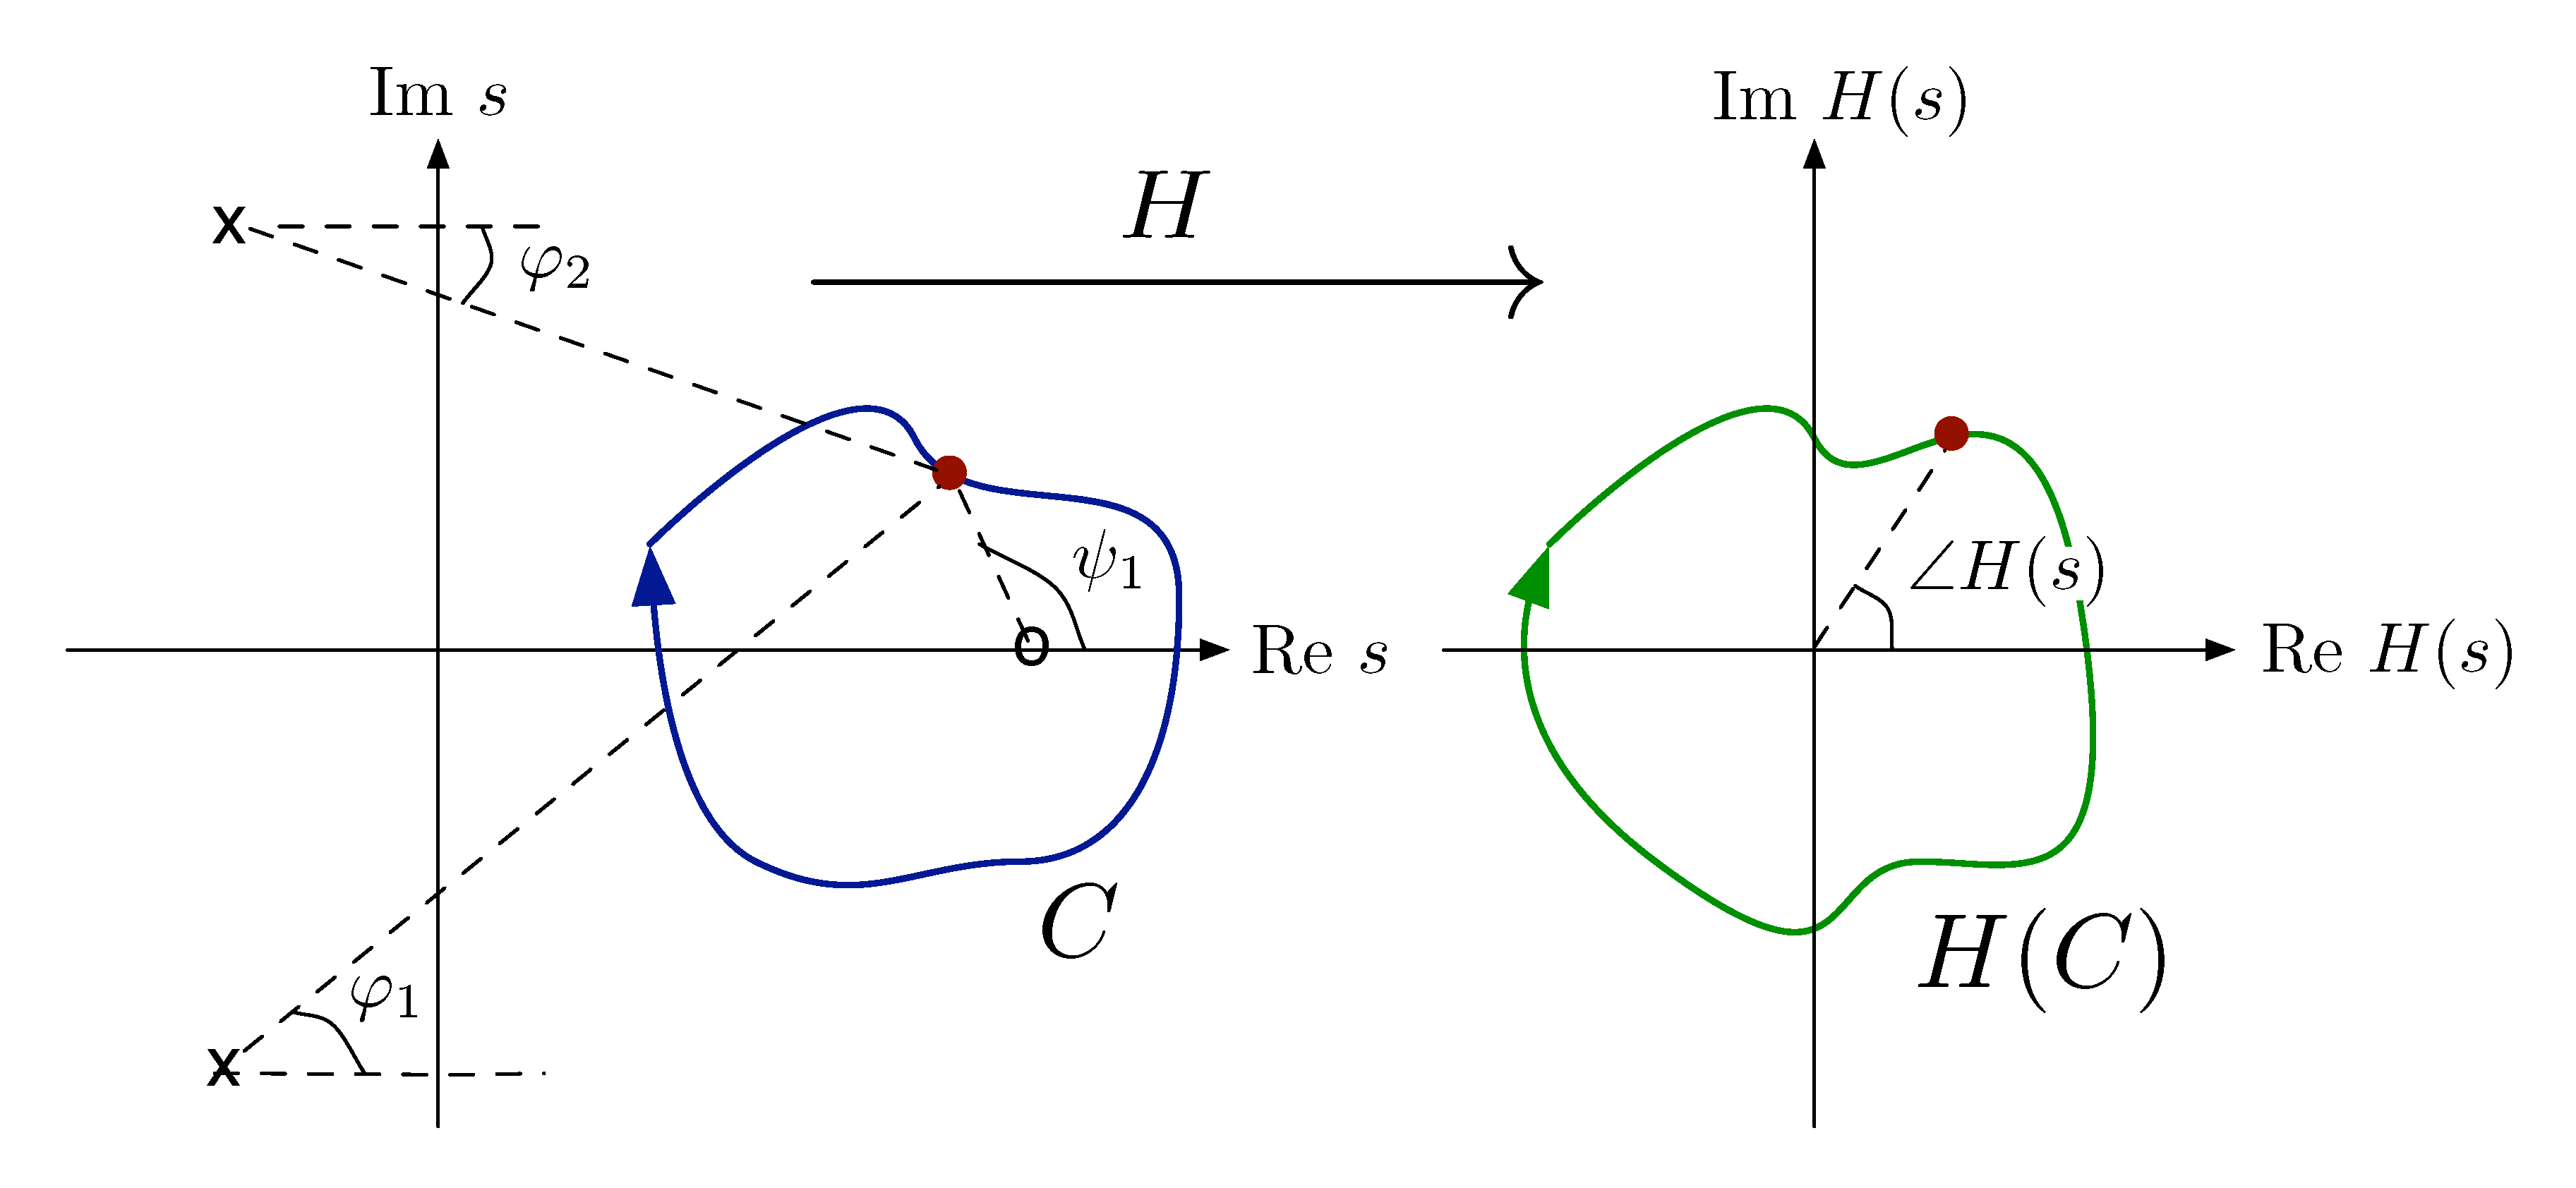
Figure 5: Closed contour \(C\) encircles a zero of \(H(s)\)
We want to know how the phase of image contour \(\angle H(s)\) change as we go around \(C\).
Let’s see what happens to angles from \(s\) to poles/zeros of \(H(s)\).
- \(\varphi_1\) and \(\varphi_2\) return to their original values.
- \(\psi_1\) picks up a net change of \(-360^\circ\).
Therefore by phase formula in Equation \eqref{d18_eq2}, \(\angle H(s)\) picks up a net change of \(-360^\circ\); \(H(C)\) encircles the origin once, clockwise (\(\circlearrowright\)) in Figure 5(b).
Case 2: Contour Encircles a Pole
Suppose that \(C\) is a closed, $\circlearrowright$-oriented contour in \(\CC\) that encircles a pole of \(H(s)\) as shown in Figure 6(a).
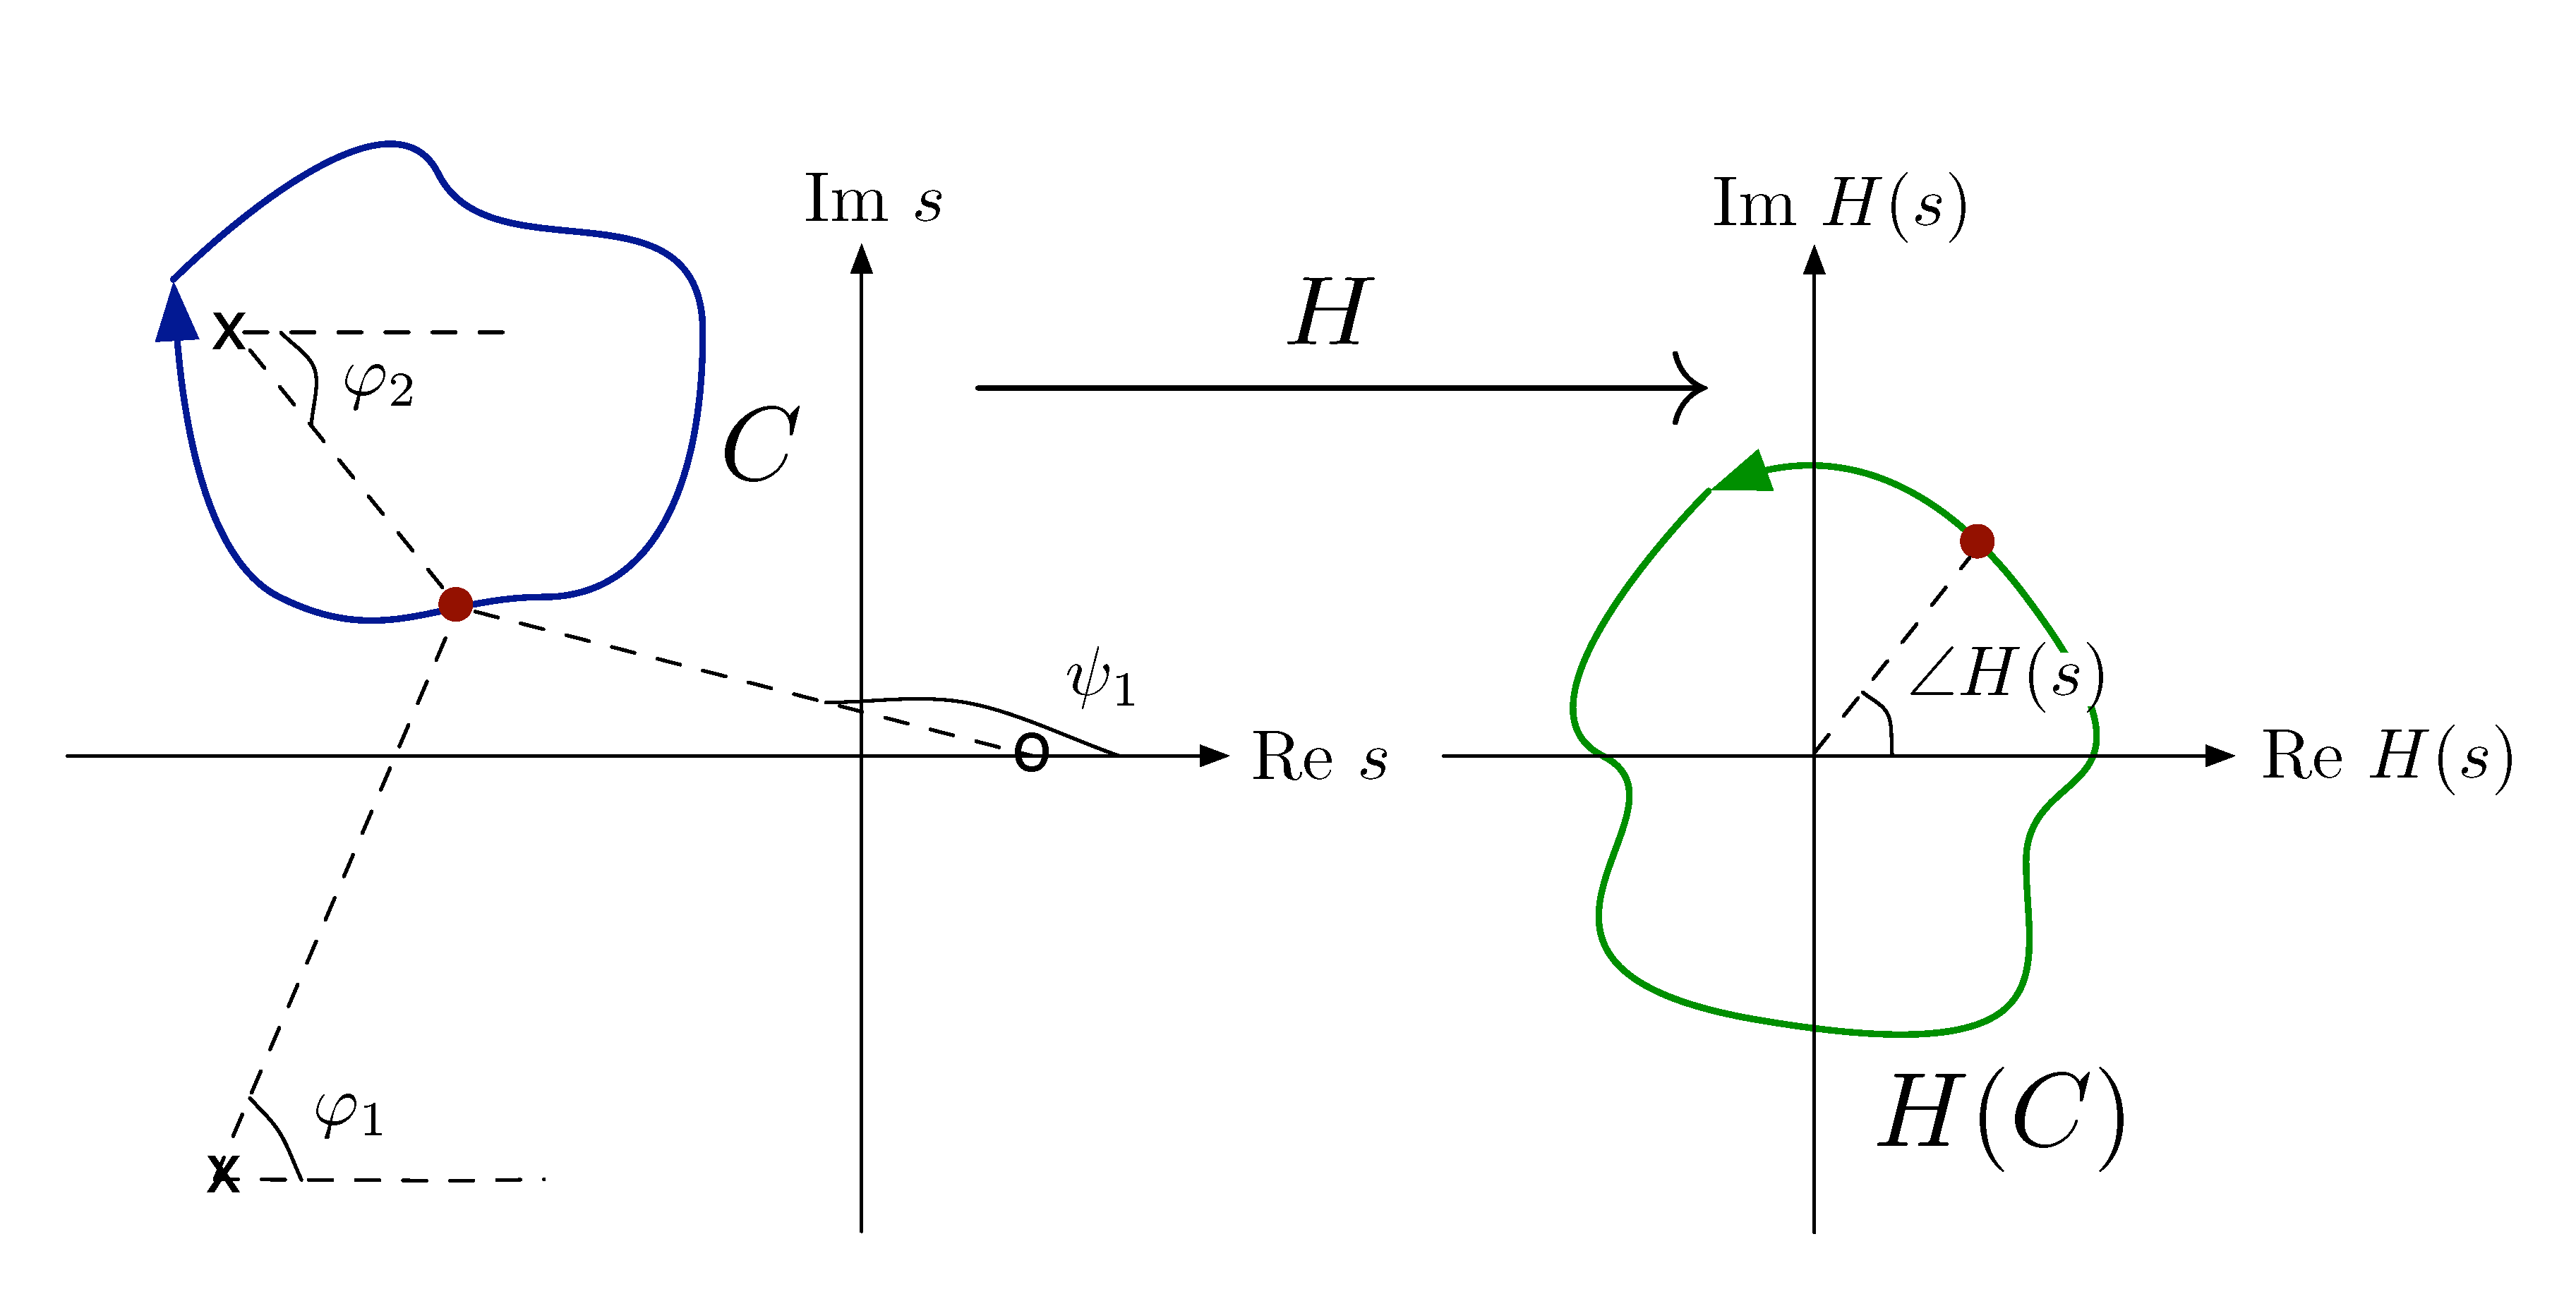
Figure 6: Closed contour \(C\) encircles a pole of \(H(s)\)
Let’s see what happens to angles from \(s\) to poles/zeros of \(H(s)\).
- \(\varphi_1\) and \(\psi_1\) return to their original values.
- \(\varphi_2\) picks up a net change of \(-360^\circ\).
Therefore by phase formula in Equation \eqref{d18_eq2}, \(\angle H(s)\) picks up a net change of \(360^\circ\); \(H(C)\) encircles the origin once counterclockwise (\(\circlearrowleft\)) in Figure 6(b).
Case 3: Contour Encircles No Poles or Zeros
Suppose that \(C\) is a closed, $\circlearrowright$-oriented contour in \(\CC\) that does not encircle any poles or zeros of \(H(s)\) as shown in Figure 7(a).
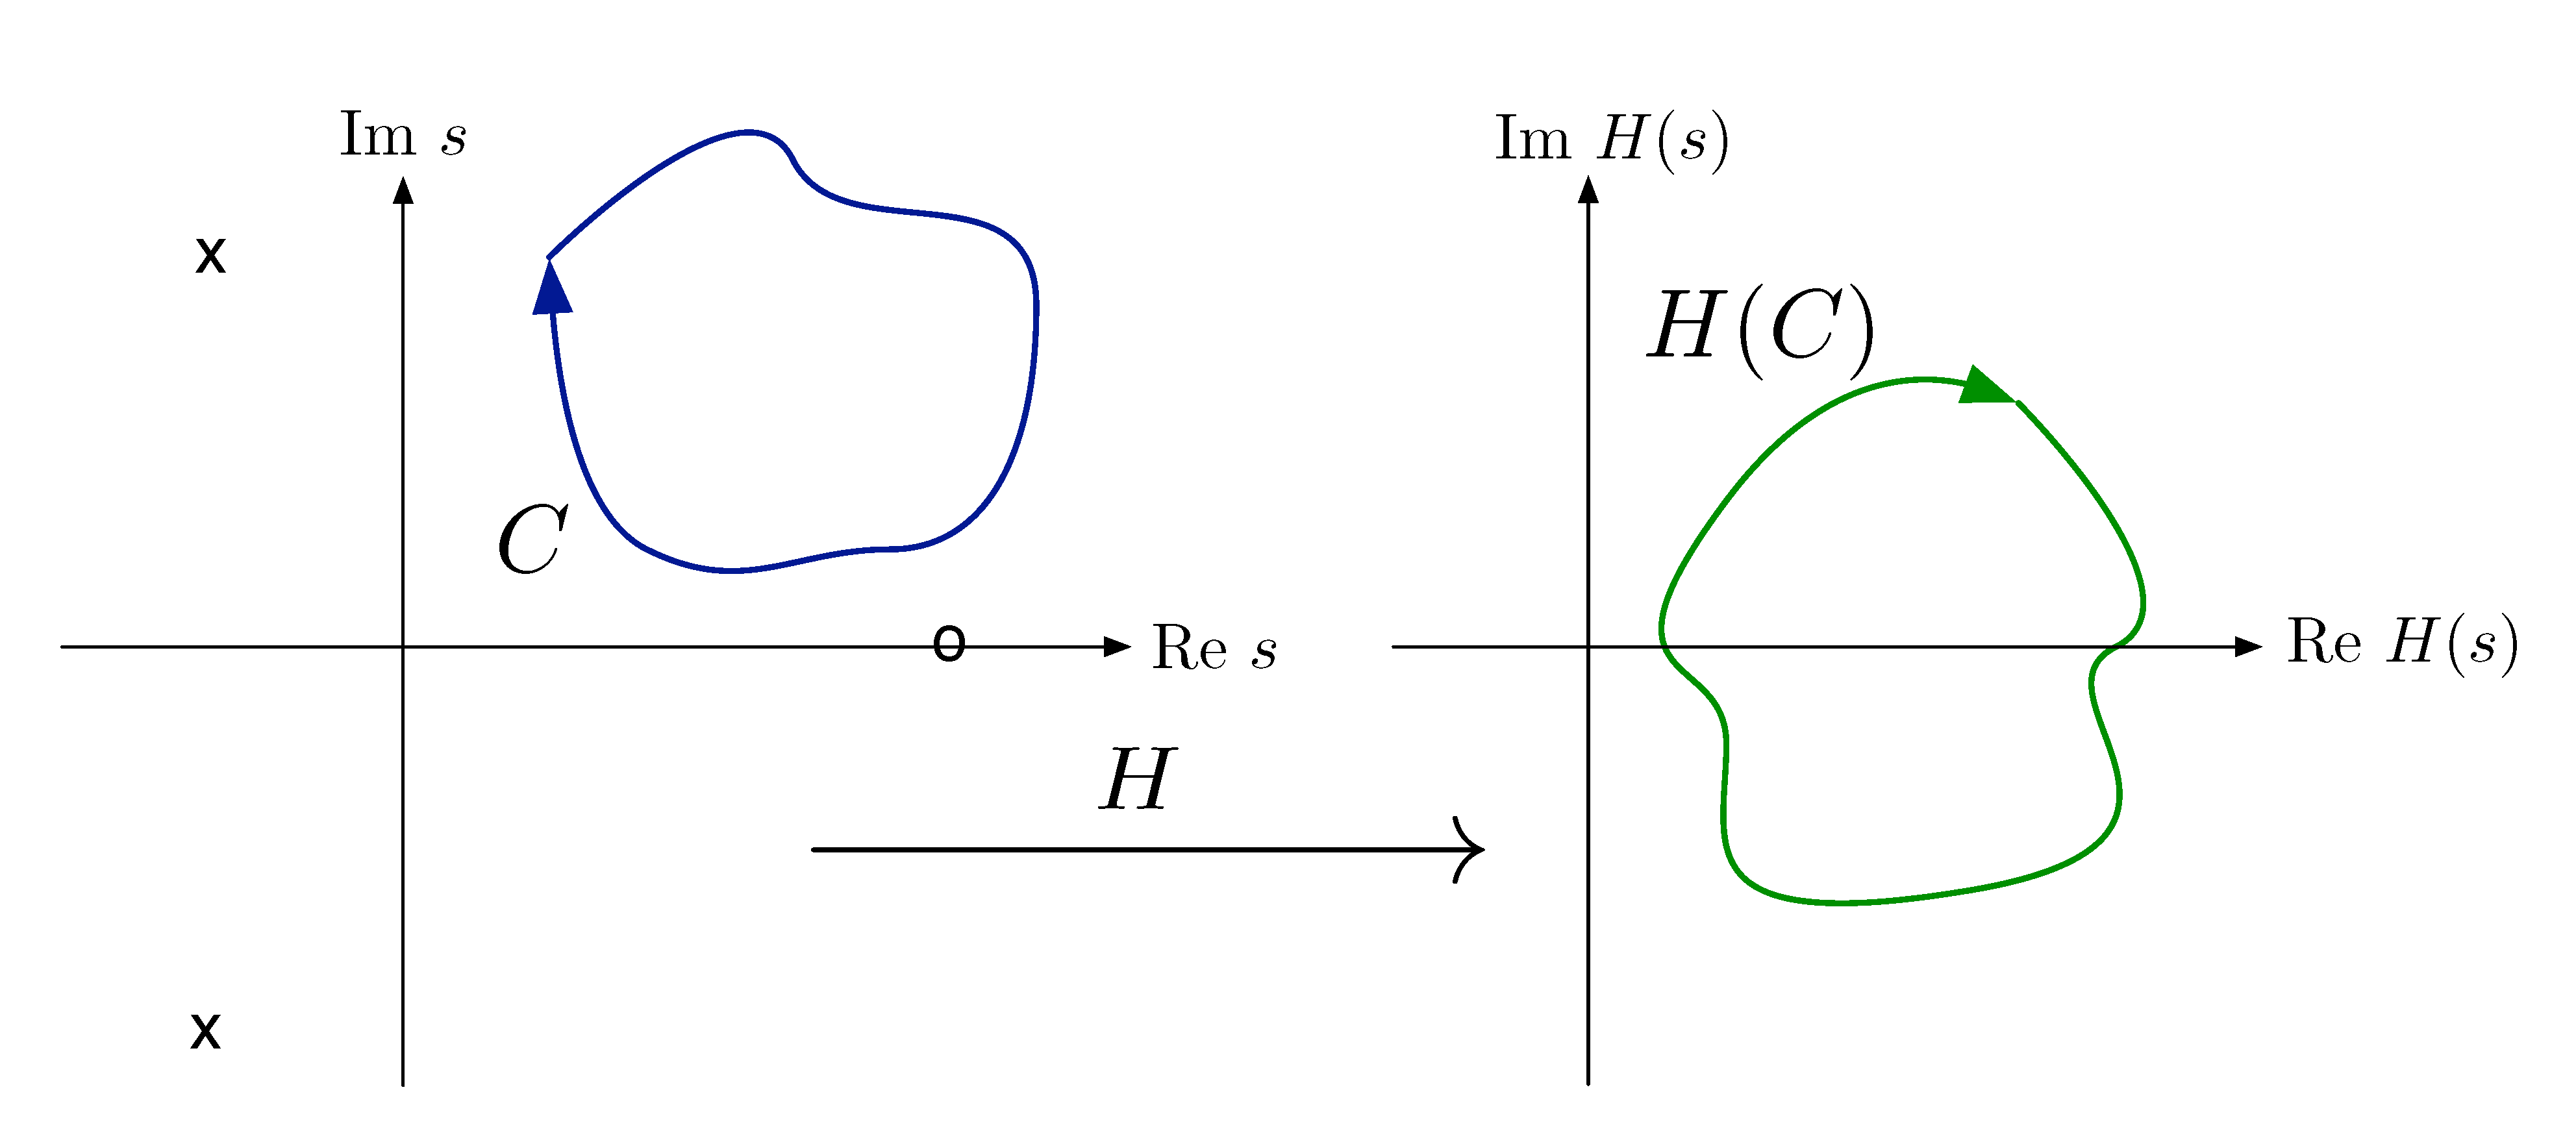
Figure 7: Closed contour \(C\) encircles no zeros or poles of \(H(s)\)
Let’s see what happens to angles from \(s\) to poles/zeros of \(H(s)\).
- \(\varphi_1,\varphi_2,\psi_1\) all return to their original values.
- There is no net change in \(\angle H(s)\).
Therefore by phase formula in Equation \eqref{d18_eq2}, \(H(C)\) does not encircle the origin in Figure 7(b).
The Argument Principle
The above special cases all lead to the following general result.
The Argument Principle (in Control): Let \(C\) be a closed, clockwise \(\circlearrowright\) oriented contour not passing through any zeros or poles\({}^*\) of transfer function \(H(s)\). Let \(H(C)\) be the image of \(C\) under the map \(s \mapsto H(s)\),
\[ H(C) = \left\{ H(s) : s \in \CC \right\}. \]
Then we have
\begin{align*} &\#(\text{clockwise encirclements $\circlearrowright$ of $0$ by $H(C)$}) \\ &=\#(\text{zeros of $H(s)$ inside $C$}) - \#(\text{poles of $H(s)$ inside $C$}). \end{align*}More succinctly,
\begin{align*} N = Z - P. \end{align*}\(^*\) We will see the reason for this assumption later.
The Argument Principle (in Math): Let \(f(z)\) be a meromorphic\(^{**}\) function on a domain \(D\) and \(\gamma \subset D\) a positively oriented\(^a\), simple\(^b\), closed\(^c\), piecewise smooth path\(^d\) that does not pass through any zero or pole of \(f(z)\). Let \(n(\gamma, z)\) be the winding number of \(\gamma\) around a point \(z \in \CC\). Then we have
\begin{align*} \underbrace{n\left(f(\gamma), 0\right)}_{\text{an integer}} &= \frac{1}{2\pi i}\int_\gamma \frac{f'(z)}{f(z)} \, \d{z} \\ &= Z - P, \end{align*}where \(Z\), \(P\) are respectively the number of zeros and poles of \(f(z)\) inside \(\gamma\) counting multiplicities.
\(^{**}\) Meromorphic means the singularities of \(f(z)\) cannot be worse than poles.
\(^a\) Counterclockwise in short. Or when we travel along the contour \(\gamma\), its inside stays on the left hand side.
\(^b\) Simple means it is not self intersecting.
\(^c\) Closed means we can start with a point on the contour and travel back to it.
\(^d\) Piecewise smoothness makes sense of path integral in the first place.
Detailed discussion of winding number can be found in standard text on complex analysis such as {Palka1991}, page 153. It also discusses Argument Principle on page 340. Other texts include [Fisher1999] and {Freitag2009} (Free on line through UI library, highly recommended).
Several remarks here. By \(N = Z - P\),
- if \(N < 0\), it means that \(H(C)\) encircles the origin counterclockwise (\(\circlearrowleft\));
- we do not want \(C\) to pass through any pole of \(H(s)\) because then \(H(C)\) would not be defined.
- we also do not want \(C\) to pass through any zero of \(H\) because then \(0 \in H(C)\), so \(\#(\text{encirclements})\) is not well-defined.
From Argument Principle to Nyquist Criterion
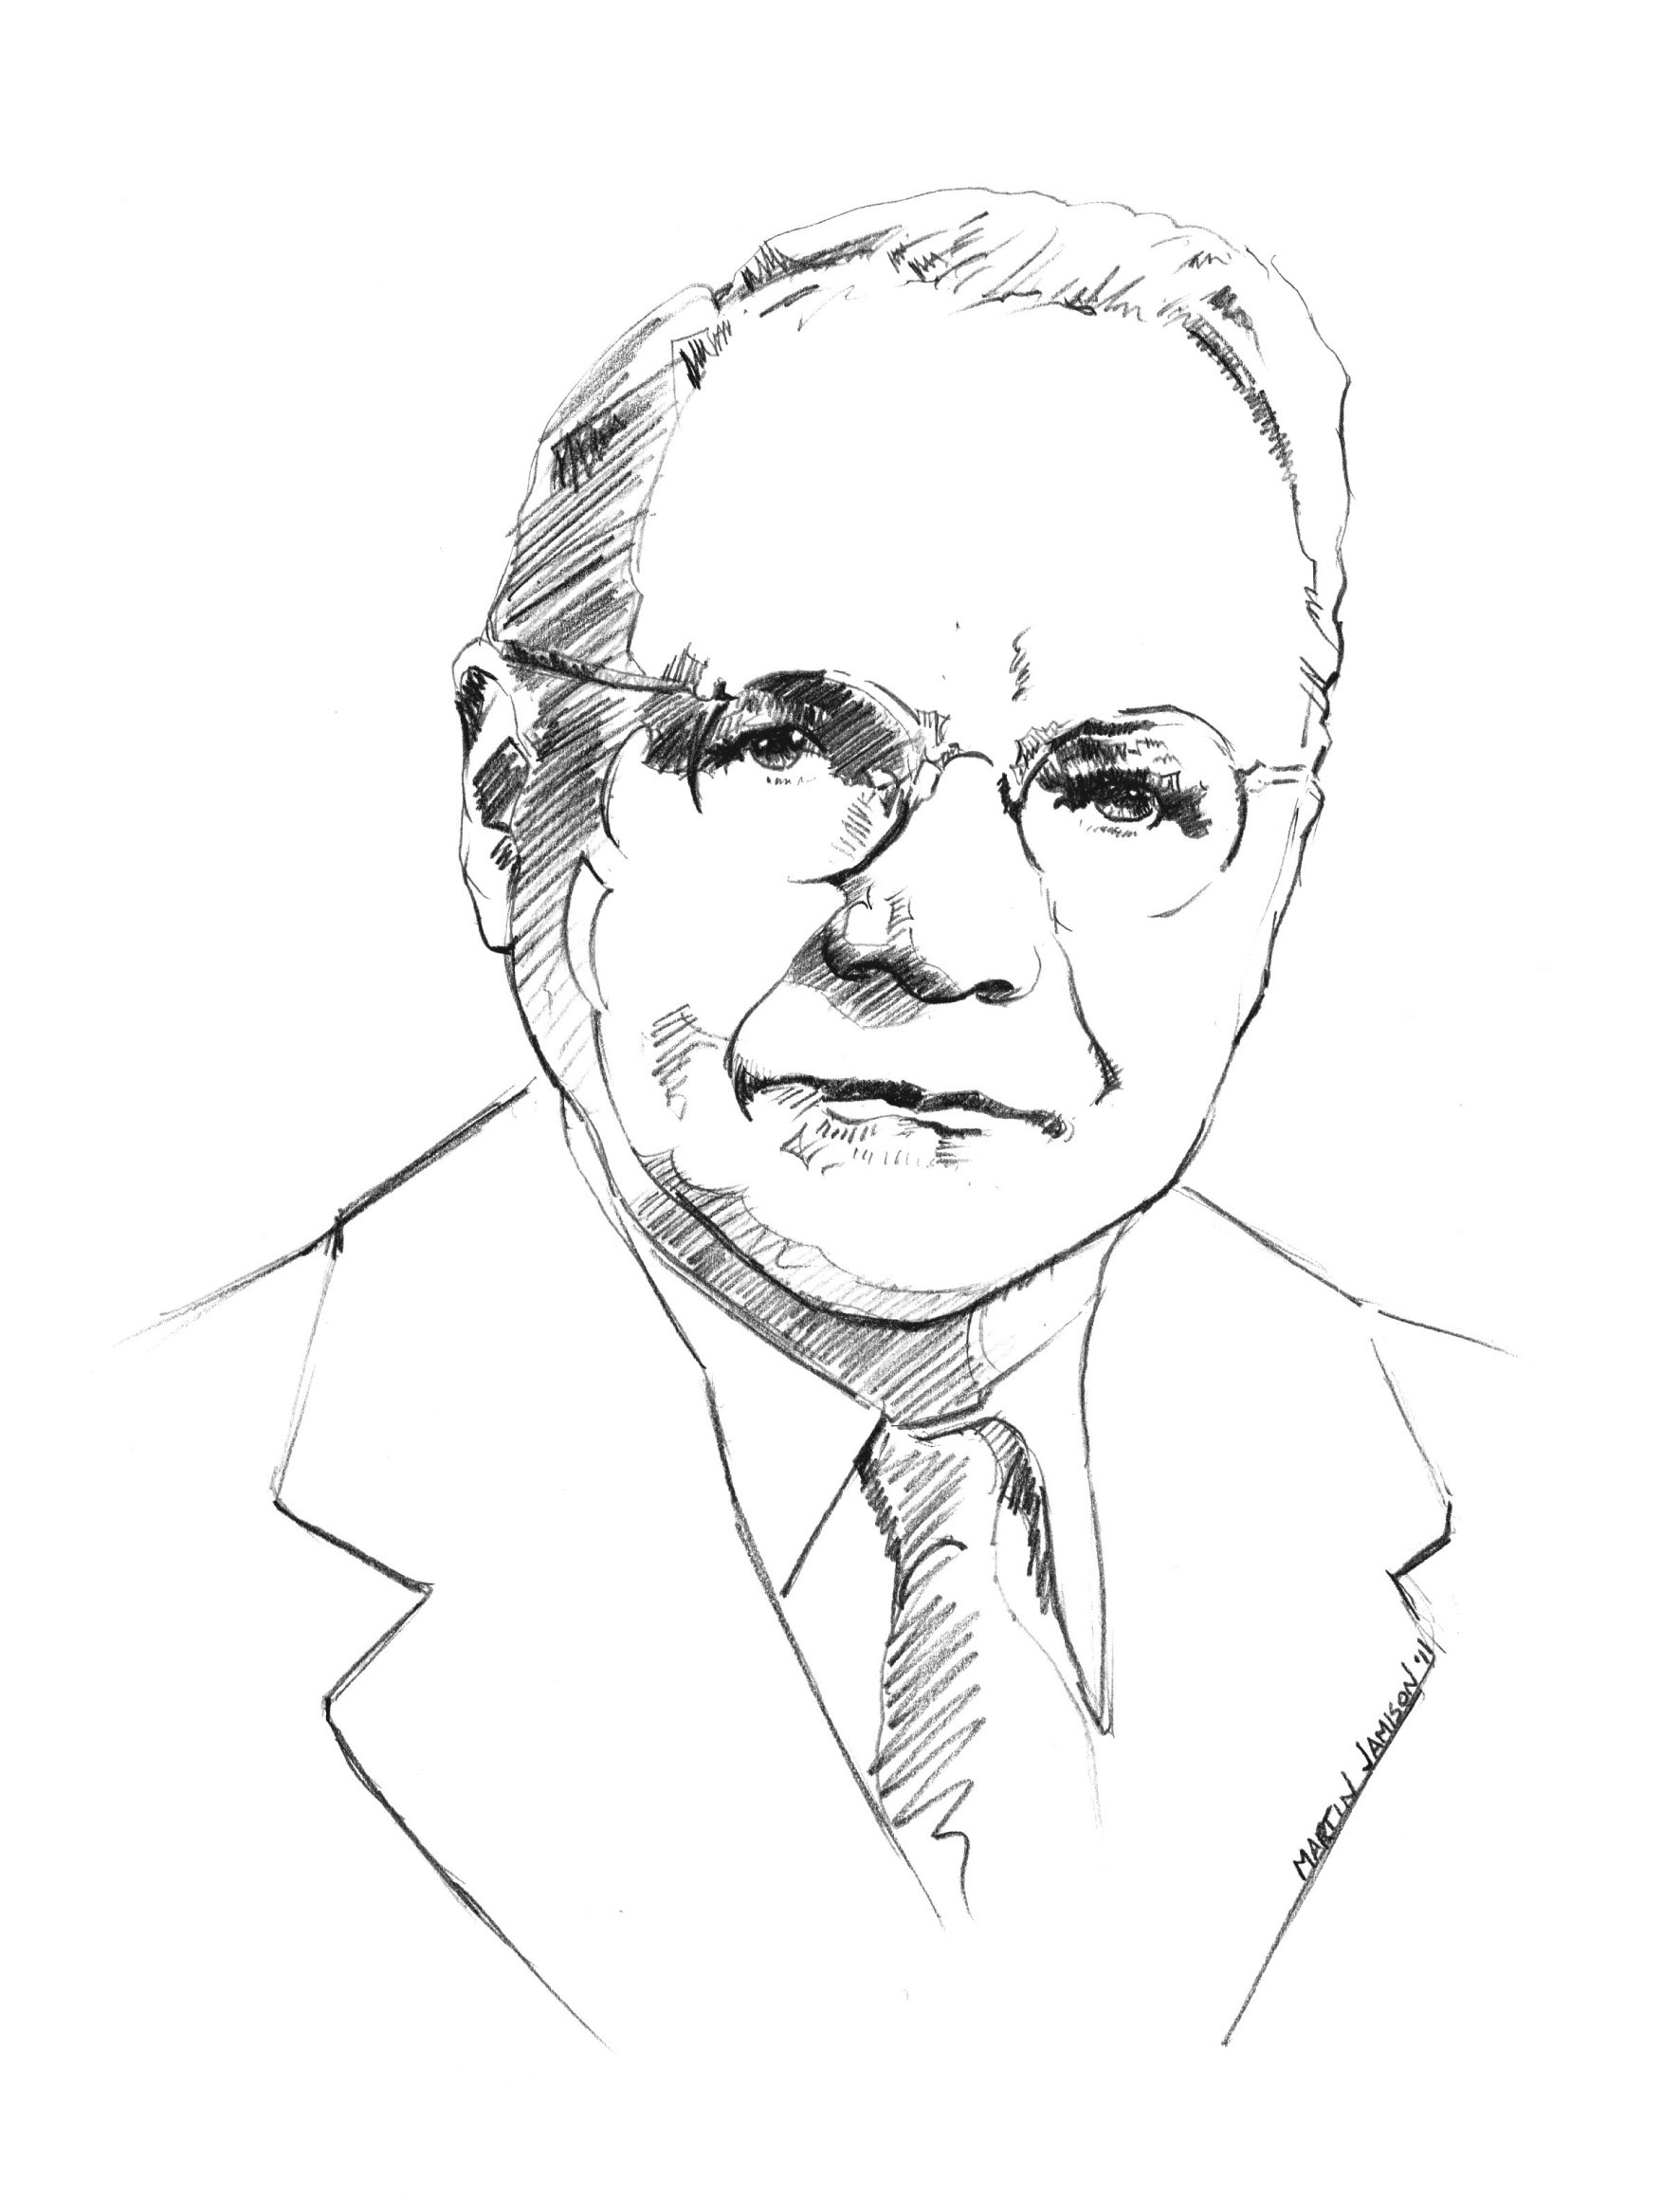
Figure 8: Harry Nyquist, 1889–1976
In control theory, we are concerned with closed loop poles, i.e., those poles falling in the Right Half Plane. Let’s choose a suitable contour \(C\) that encloses the entire RHP as shown in Figure 9.
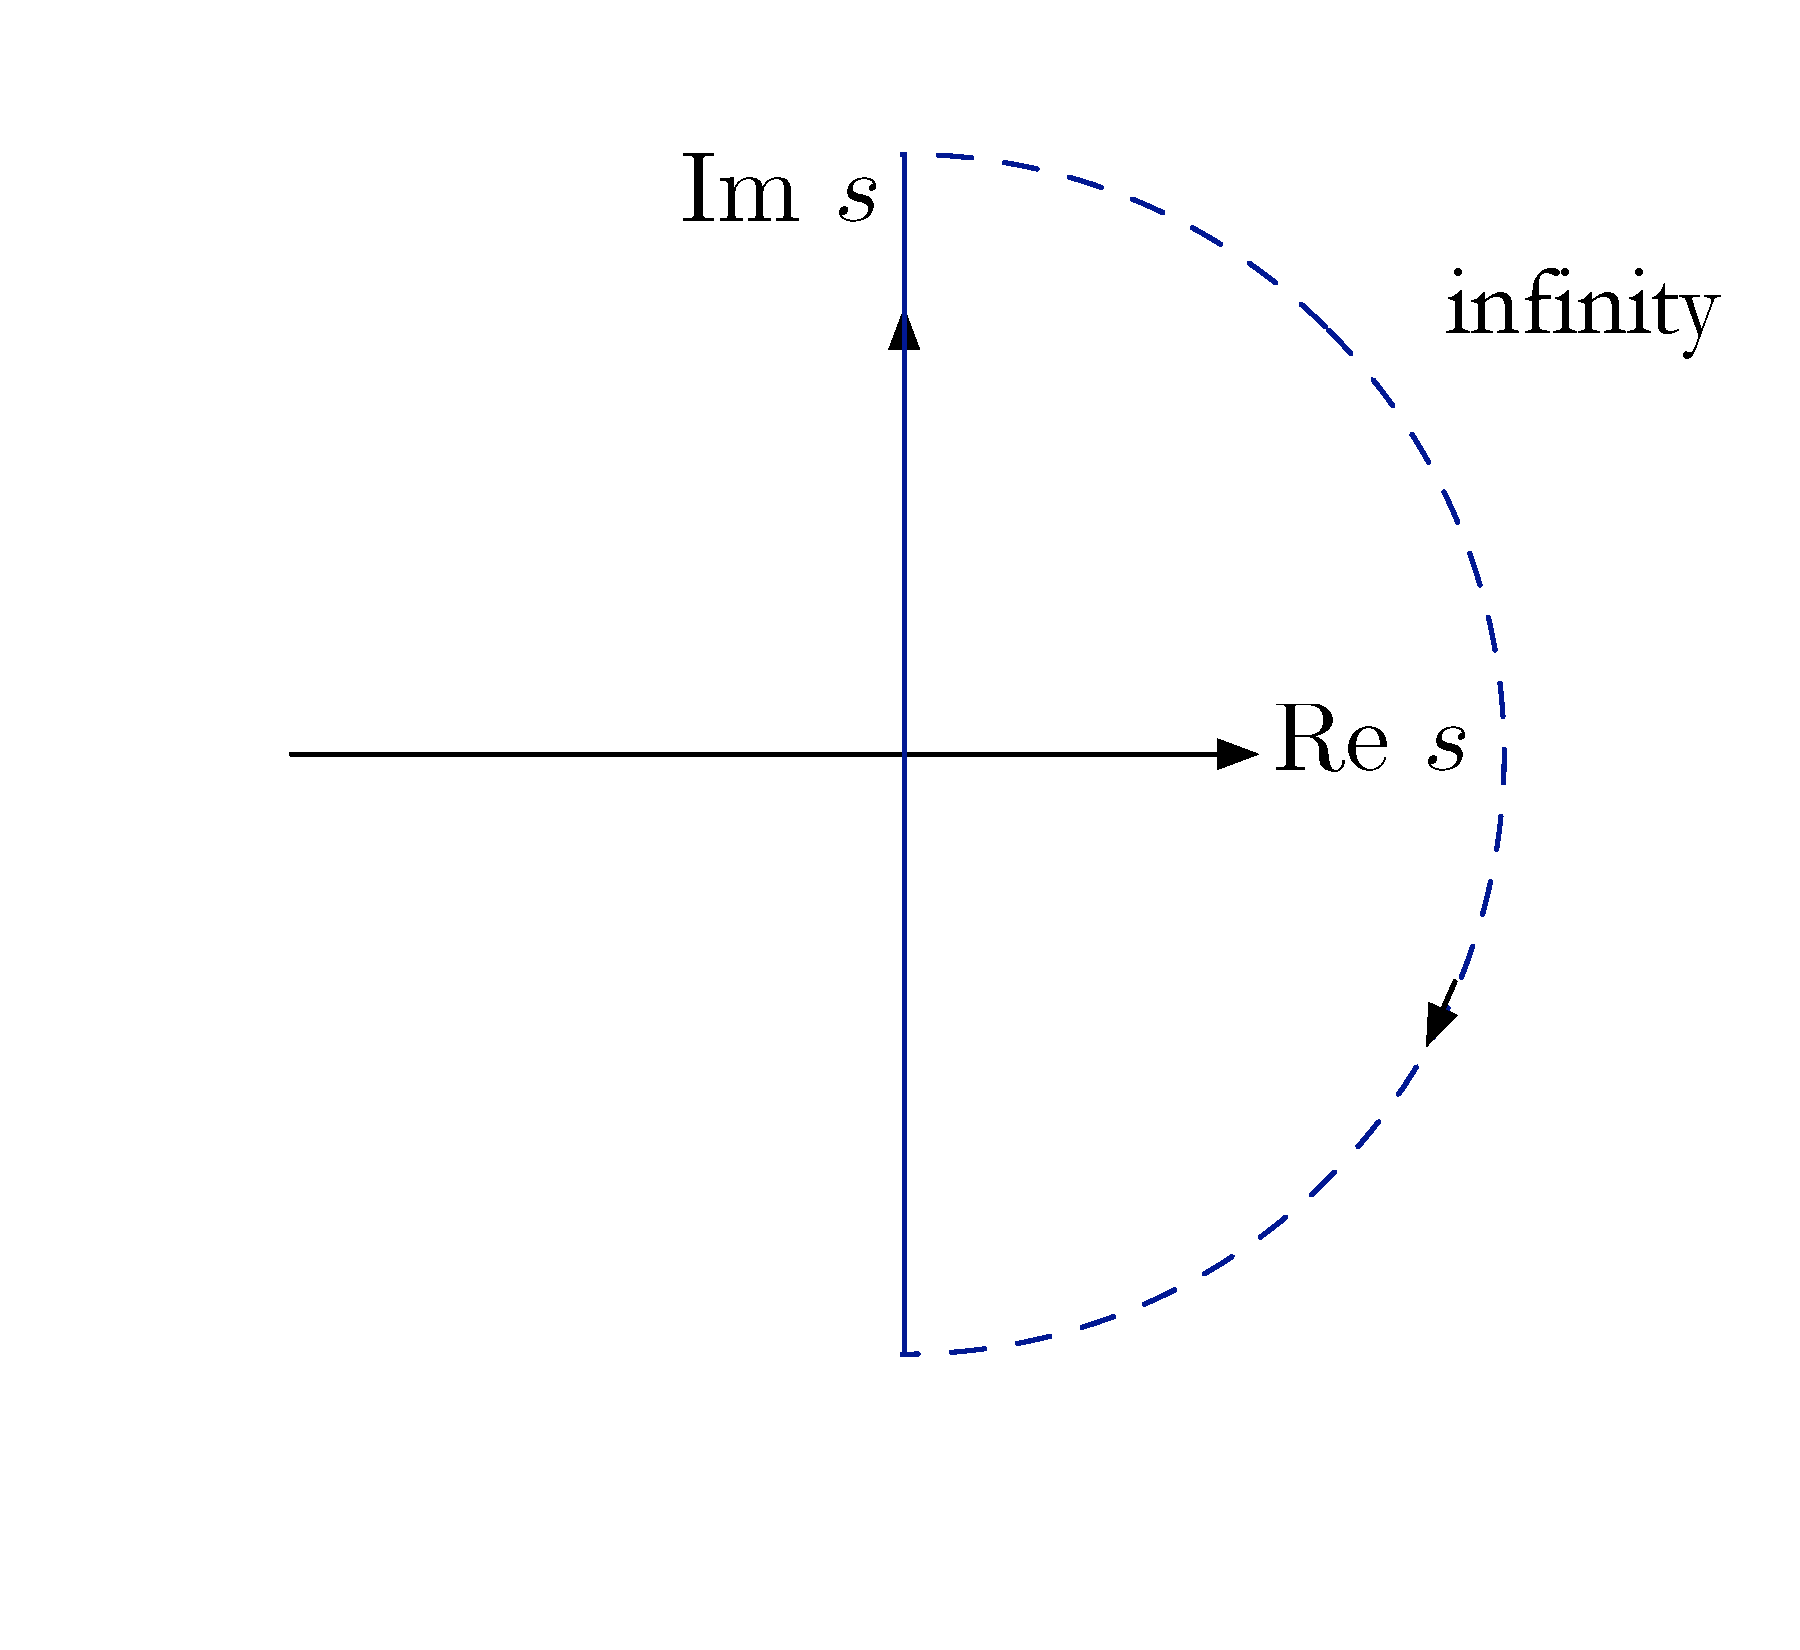
Figure 9: Contour \(C\) encloses the RHP
We see from Figure 9, the closed contour \(C\) is the union of imaginary axis and the semi-circular path at infinity. Note if \(H(s)\) is strictly proper, then \(H(\infty) = 0\).
With this choice of \(C\),
\[ H(C) = \text{Nyquist plot of $H$}. \]
Indeed, the image curve of the imaginary axis under the map \(H : \CC \to \CC\) is just the Nyquist plot since if \(H(s)\) is strictly proper, \(H(\infty) = 0\).
From Argument Principle to Nyquist Criterion
Recall the control diagram for our closed loop set-up in Figure 1. We are interested in RHP roots of characteristic polynomial \(1 + KG(s)\), where \(G\) is the plant transfer function.
We can set \(H(s) = 1 + KG(s)\) and apply the argument principle to \(H(s)\).
We now examine the Nyquist plot of \(H(s) = 1+KG(s)\). By the argument principle,
\begin{align*} N &= Z-P, \\ \text{where } N &= \#(\text{$\circlearrowright$ encirclements of $0$ by Nyquist plot of $1+KG(s)$}), \\ Z & = \#(\text{zeros of $1+KG(s)$ inside $C$}), \\ P & = \#(\text{poles of $1+KG(s)$ inside $C$}). \end{align*}Now we extract information about RHP roots of \(1+KG(s)\).
Nyquist Criterion: Number of Encirclements \(N\)
The original encirclement of origin by \(1 + KG(s)\) from the argument principle can be translated to encirclement of \(-1\) by \(KG(s)\) and \(-\frac{1}K\) by \(G(s)\) itself.
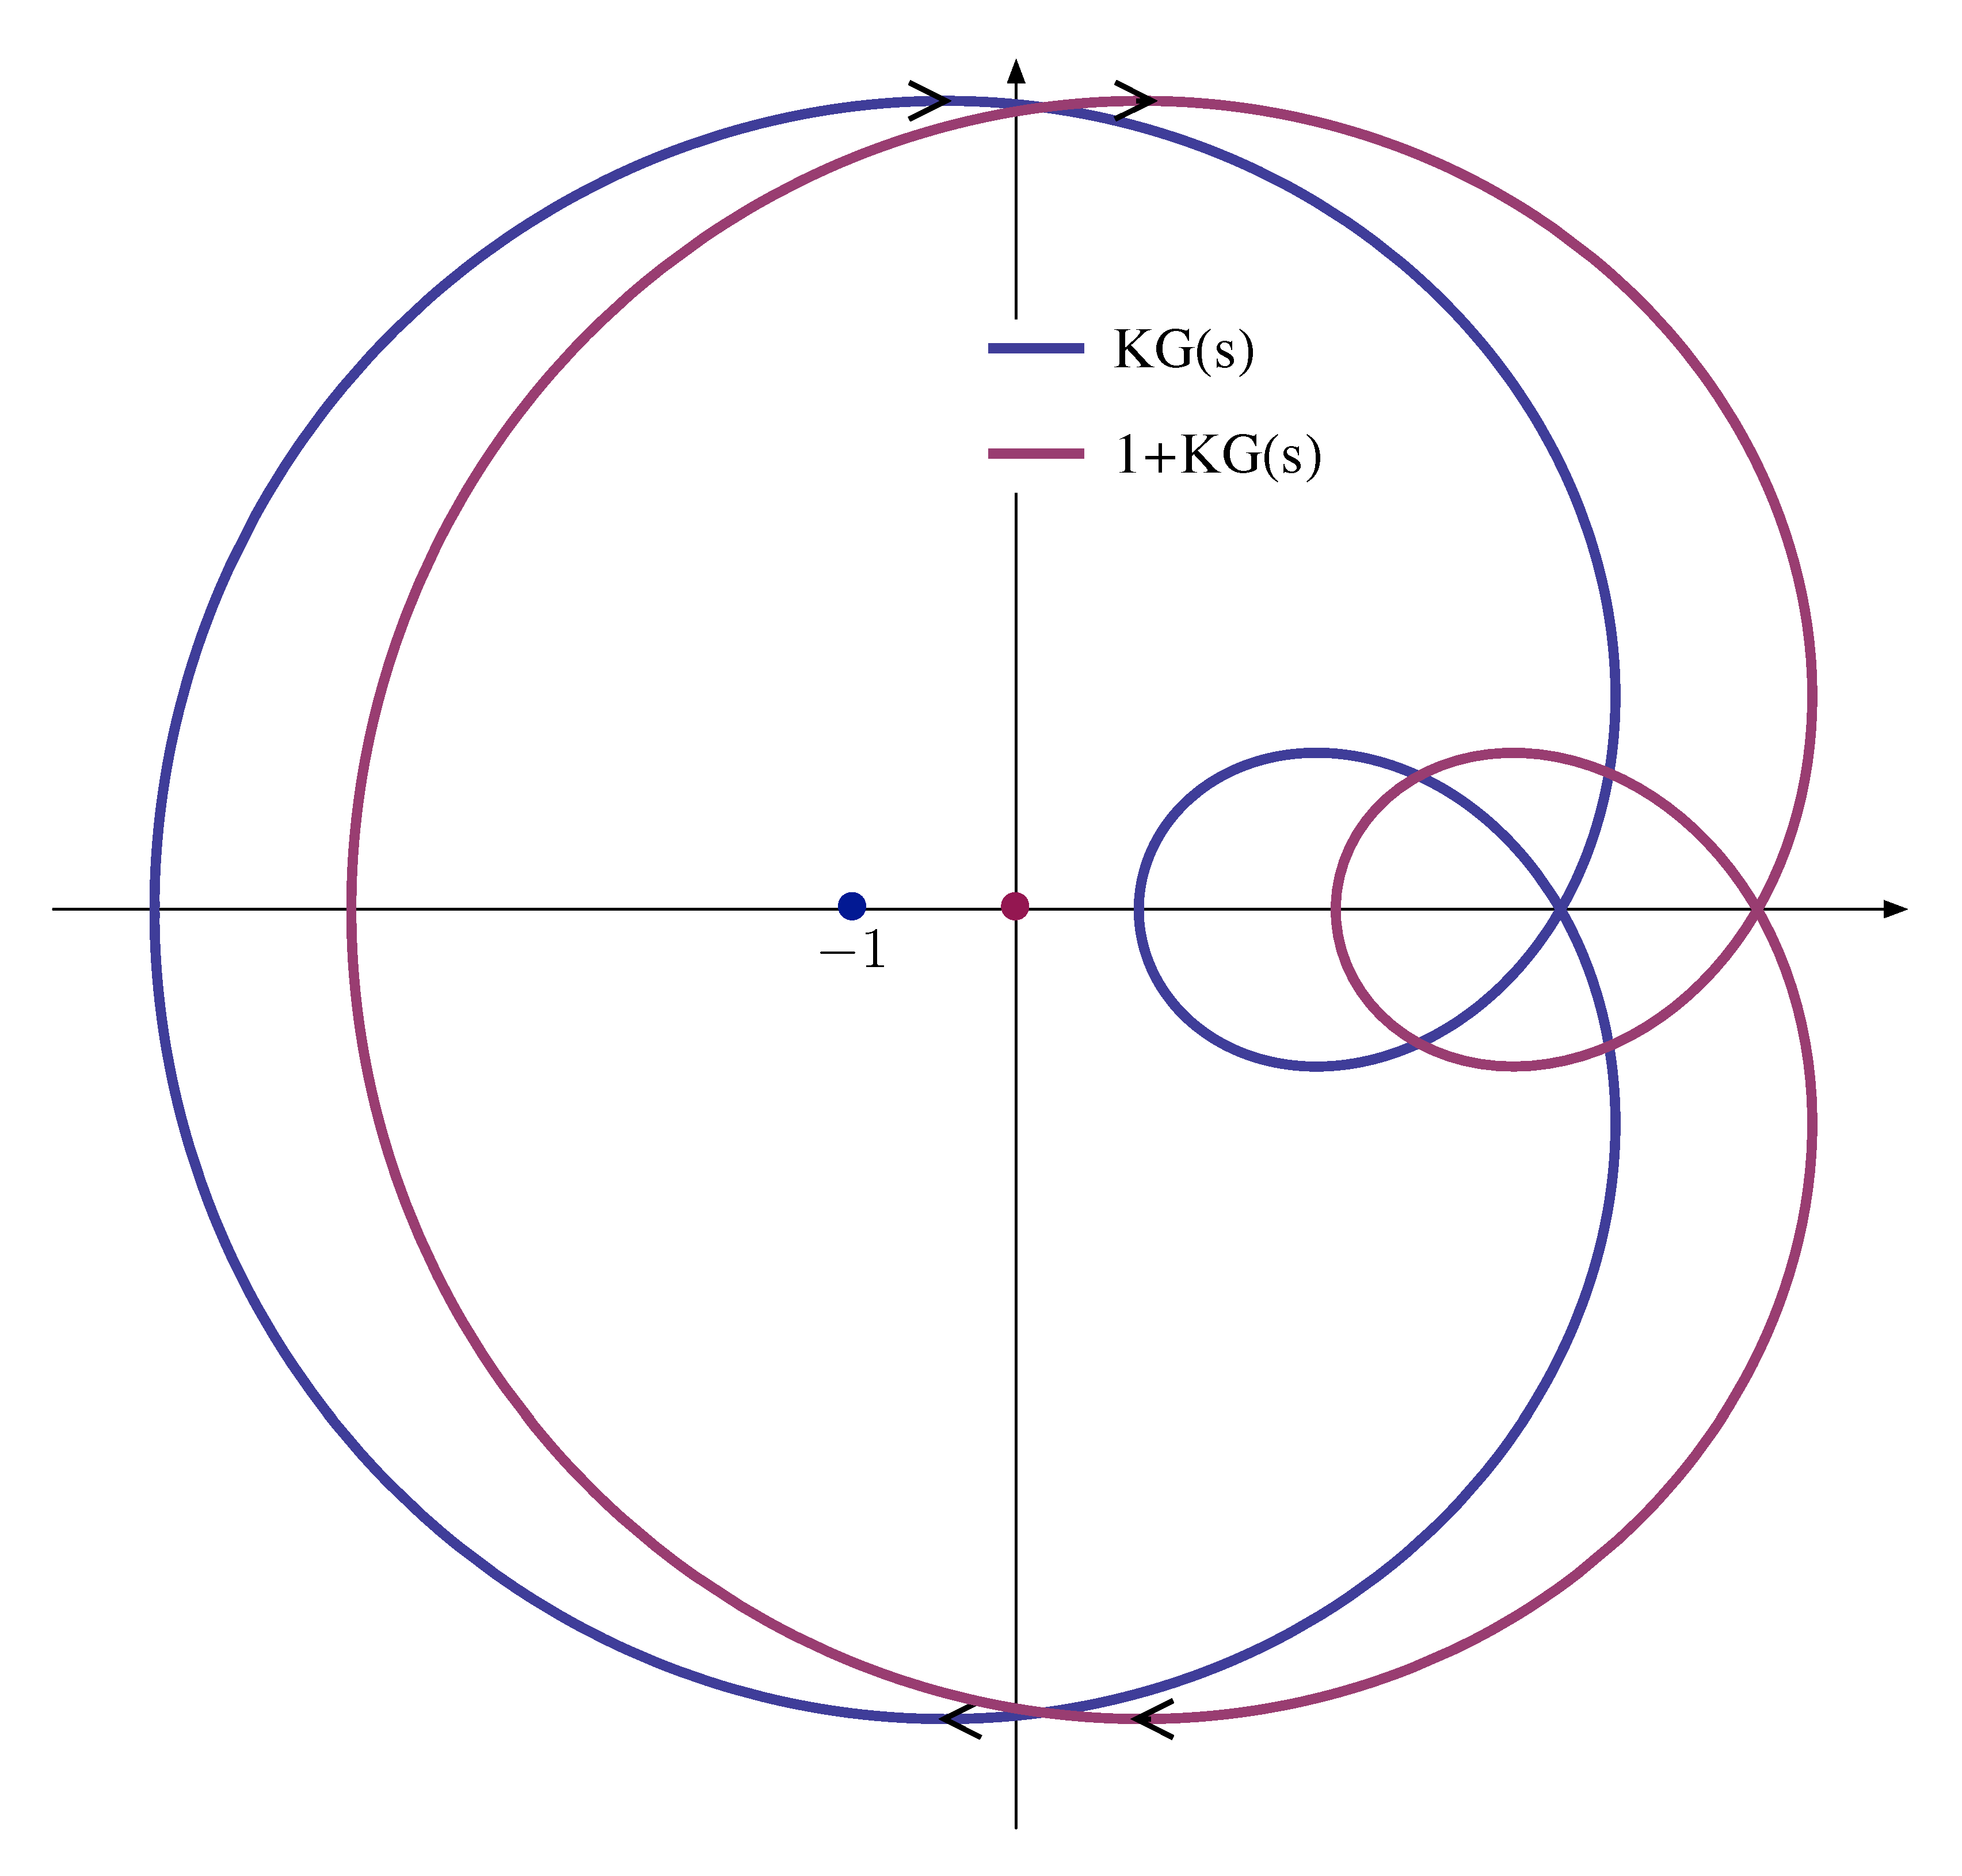
Figure 10: Nyquist plots of \(1 + KG(s)\) and \(KG(s)\)
The last interpretation of encirclement of \(N\) means it can be read off the Nyquist plot of the open loop transfer function \(G(s)\).
Nyquist Criterion: Number of Zeros \(Z\)
The number of zeros of \(H(s) = 1+KG(s)\) inside the contour \(C\) is the same as the number of closed loop poles in the Right Half Plane.
To see this, let \(G(s) = \frac{q(s)}{p(s)}\) where \(\deg(q) \le \deg(p)\). By inspecting the characteristic polynomial and the closed loop transfer function \(\frac{Y}R(s)\), we notice
\begin{align*} 1+KG(s) &= \frac{\color{red}{p(s)+Kq(s)}}{p(s)} \\ \frac{Y}R(s) &= \frac{KG(s)}{1+KG(s)} \\ &= \frac{Kq(s)}{\color{red}{p(s)+Kq(s)}}. \end{align*}Therefore,
\begin{align*} Z &= \#(\text{zeros of $1+KG(s)$ inside $C$}) \\ &= \#(\text{RHP zeros of $1+KG(s)$}) \\ &= \#(\text{RHP closed-loop poles}). \end{align*}Nyquist Criterion: Number of Poles \(P\)
The number of poles of \(H(s) = 1 + KG(s)\) inside the contour \(C\) is the same as the number of open loop poles in the Right Half Plane.
To see this, calculate the characteristic polynomial in terms of \(p(s), q(s)\) then observe
\begin{align*} 1+KG(s) &= 1 + K\frac{q(s)}{\color{red}{p(s)}} \\ &= \frac{p(s) + Kq(s)}{\color{red}{p(s)}}. \end{align*}Therefore,
\begin{align*} P &= \#(\text{poles of $1+KG(s)$ inside $C$}) \\ &= \#(\text{RHP poles of $1+KG(s)$}) \\ &= \#(\text{RHP roots of $p(s)$}) \\ &= \#(\text{RHP open-loop poles}). \end{align*}The Nyquist Theorem
Now we can state the Nyquist theorem.
Nyquist Theorem (1932): Assume that \(G(s)\) has no poles on the imaginary axis\(^*\), and that its Nyquist plot does not pass through the point \(-1/K\). Then
\begin{align*} N &= \#(\text{$\circlearrowright$ of $-1/K$ by Nyquist plot of $G(s)$}) \\ &= Z- P \\ &= \#(\text{RHP closed loop poles}) - \#(\text{RHP open loop poles}). \end{align*}\(^*\) If there is one, we may draw an infinitesimally small circular path that goes around the pole while it stays in the Right Half Plane.
The Nyquist Stability Criterion
By the Nyquist theorem,
\begin{align*} &\underbrace{N}_{\#(\circlearrowright \text{ of $-1/K$})} = \underbrace{Z}_{\#(\text{unstable CL poles})} - \underbrace{P}_{\#(\text{unstable OL poles})}\\ \implies Z &= N + P. \\ \text{ If } Z &= 0 \text{ then } N = - P. \end{align*}Under the assumptions of the Nyquist theorem, Nyquist Stability Criterion says the closed loop system at a given gain \(K\) is stable if and only if the Nyquist plot of \(G(s)\) encircles the point \((-\frac{1}K,0)\) counterclockwise \(P\) times, where \(P\) is the number of unstable (RHP) open loop poles of \(G(s)\).
Applying the Nyquist Criterion
When applying the Nyquist Criterion, we can follow the workflow.
- Sketch the Bode plots, obtain the magnitude \(M\) plot and phase \(\phi\) plot.
- Use Bode plot to sketch Nyquist plot.
- Count the encirclements.
The advantages of Nyquist over Routh–Hurwitz are
- We can work directly with experimental frequency response data. For example, we may obtain the Bode plot based on measurements, but do not necessarily know the transfer function before hand.
- Nyquist Criterion is less computational, more geometric. (Also came some \(55\) years after Routh Criterion.)
Example 1: Consider the open loop transfer function with standard unity feedback configuration in Figure 1, where
\[ G(s) = \frac{1}{(s+1)(s+2)}. \,\text{(no open loop RHP poles)} \]
Determine the range of \(K\) such that the closed loop system is stable.
Solution: First, let’s solve the problem by Routh Criterion. By Characteristic equation,
\begin{align*} (s+1)(s+2) + K = 0 \iff s^2 + 3s + K+2 = 0. \end{align*}From Routh Criterion for second degree polynomial, we know that the closed loop system is stable for \(K>-2\).
Next, we try to reproduce the same answer using the Nyquist criterion.
- Start with the Bode plot of \(G(j\omega)\) as shown in Figure 11.
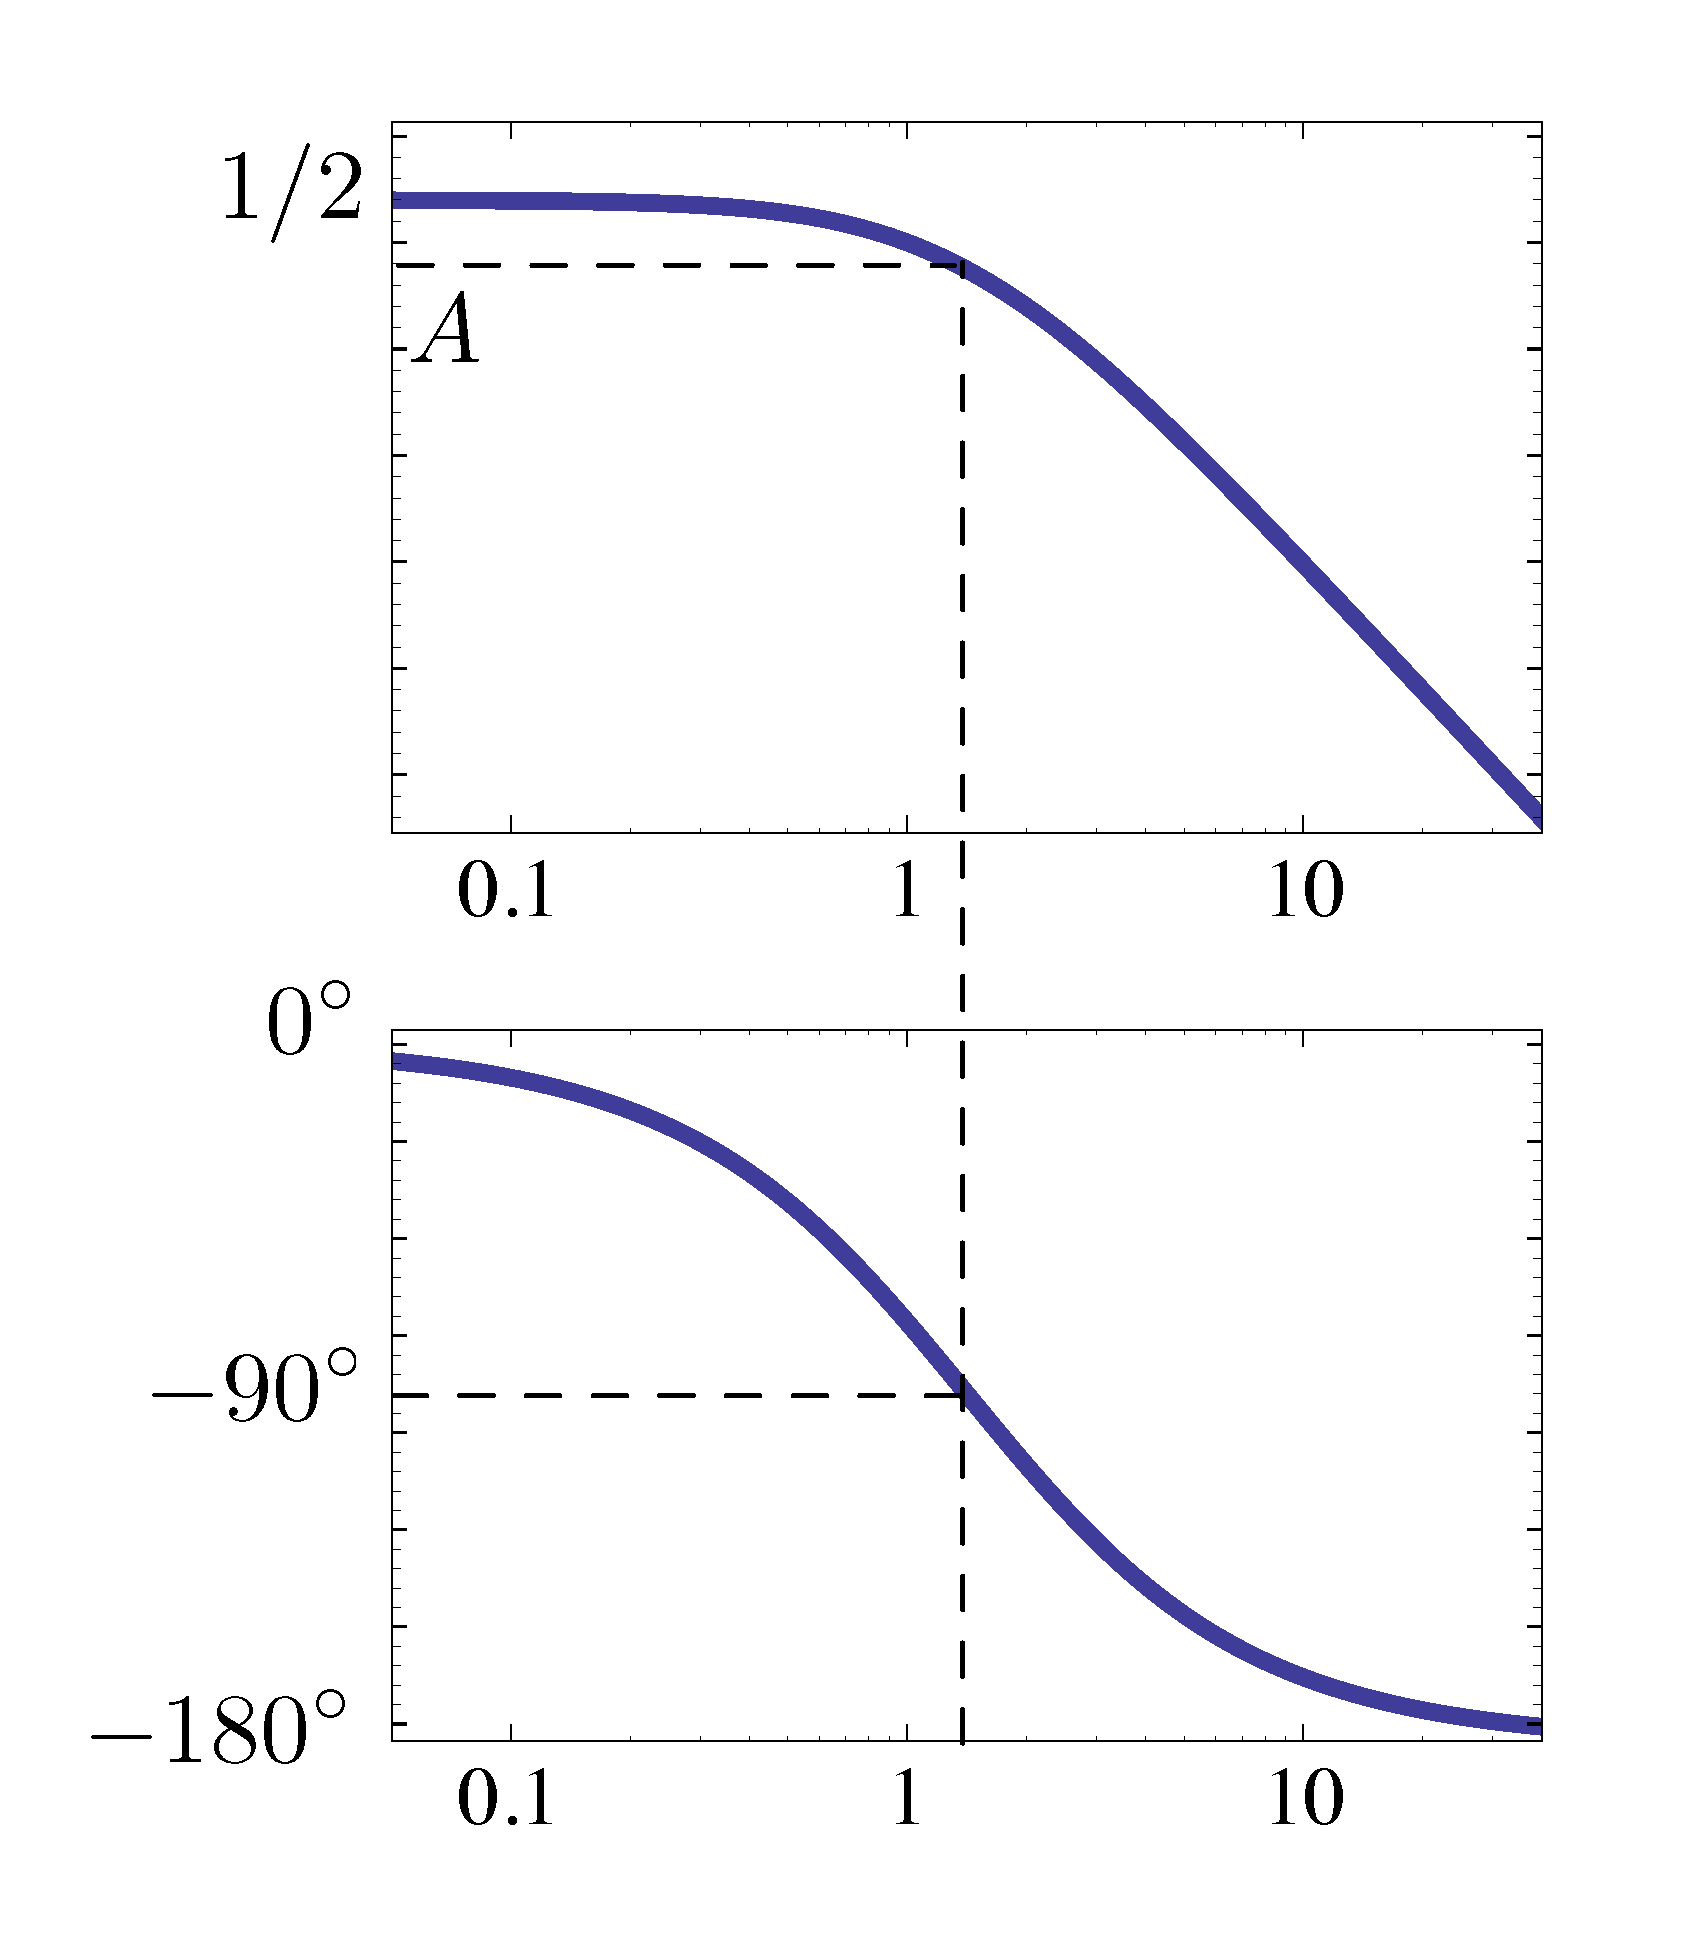
Figure 11: Bode plot of \(G(j\omega)\)
- Use the Bode plot to graph \(\text{Im } G(j\omega)\) versus \(\text{Re } G(j\omega)\) for \(0 \le \omega < \infty\).
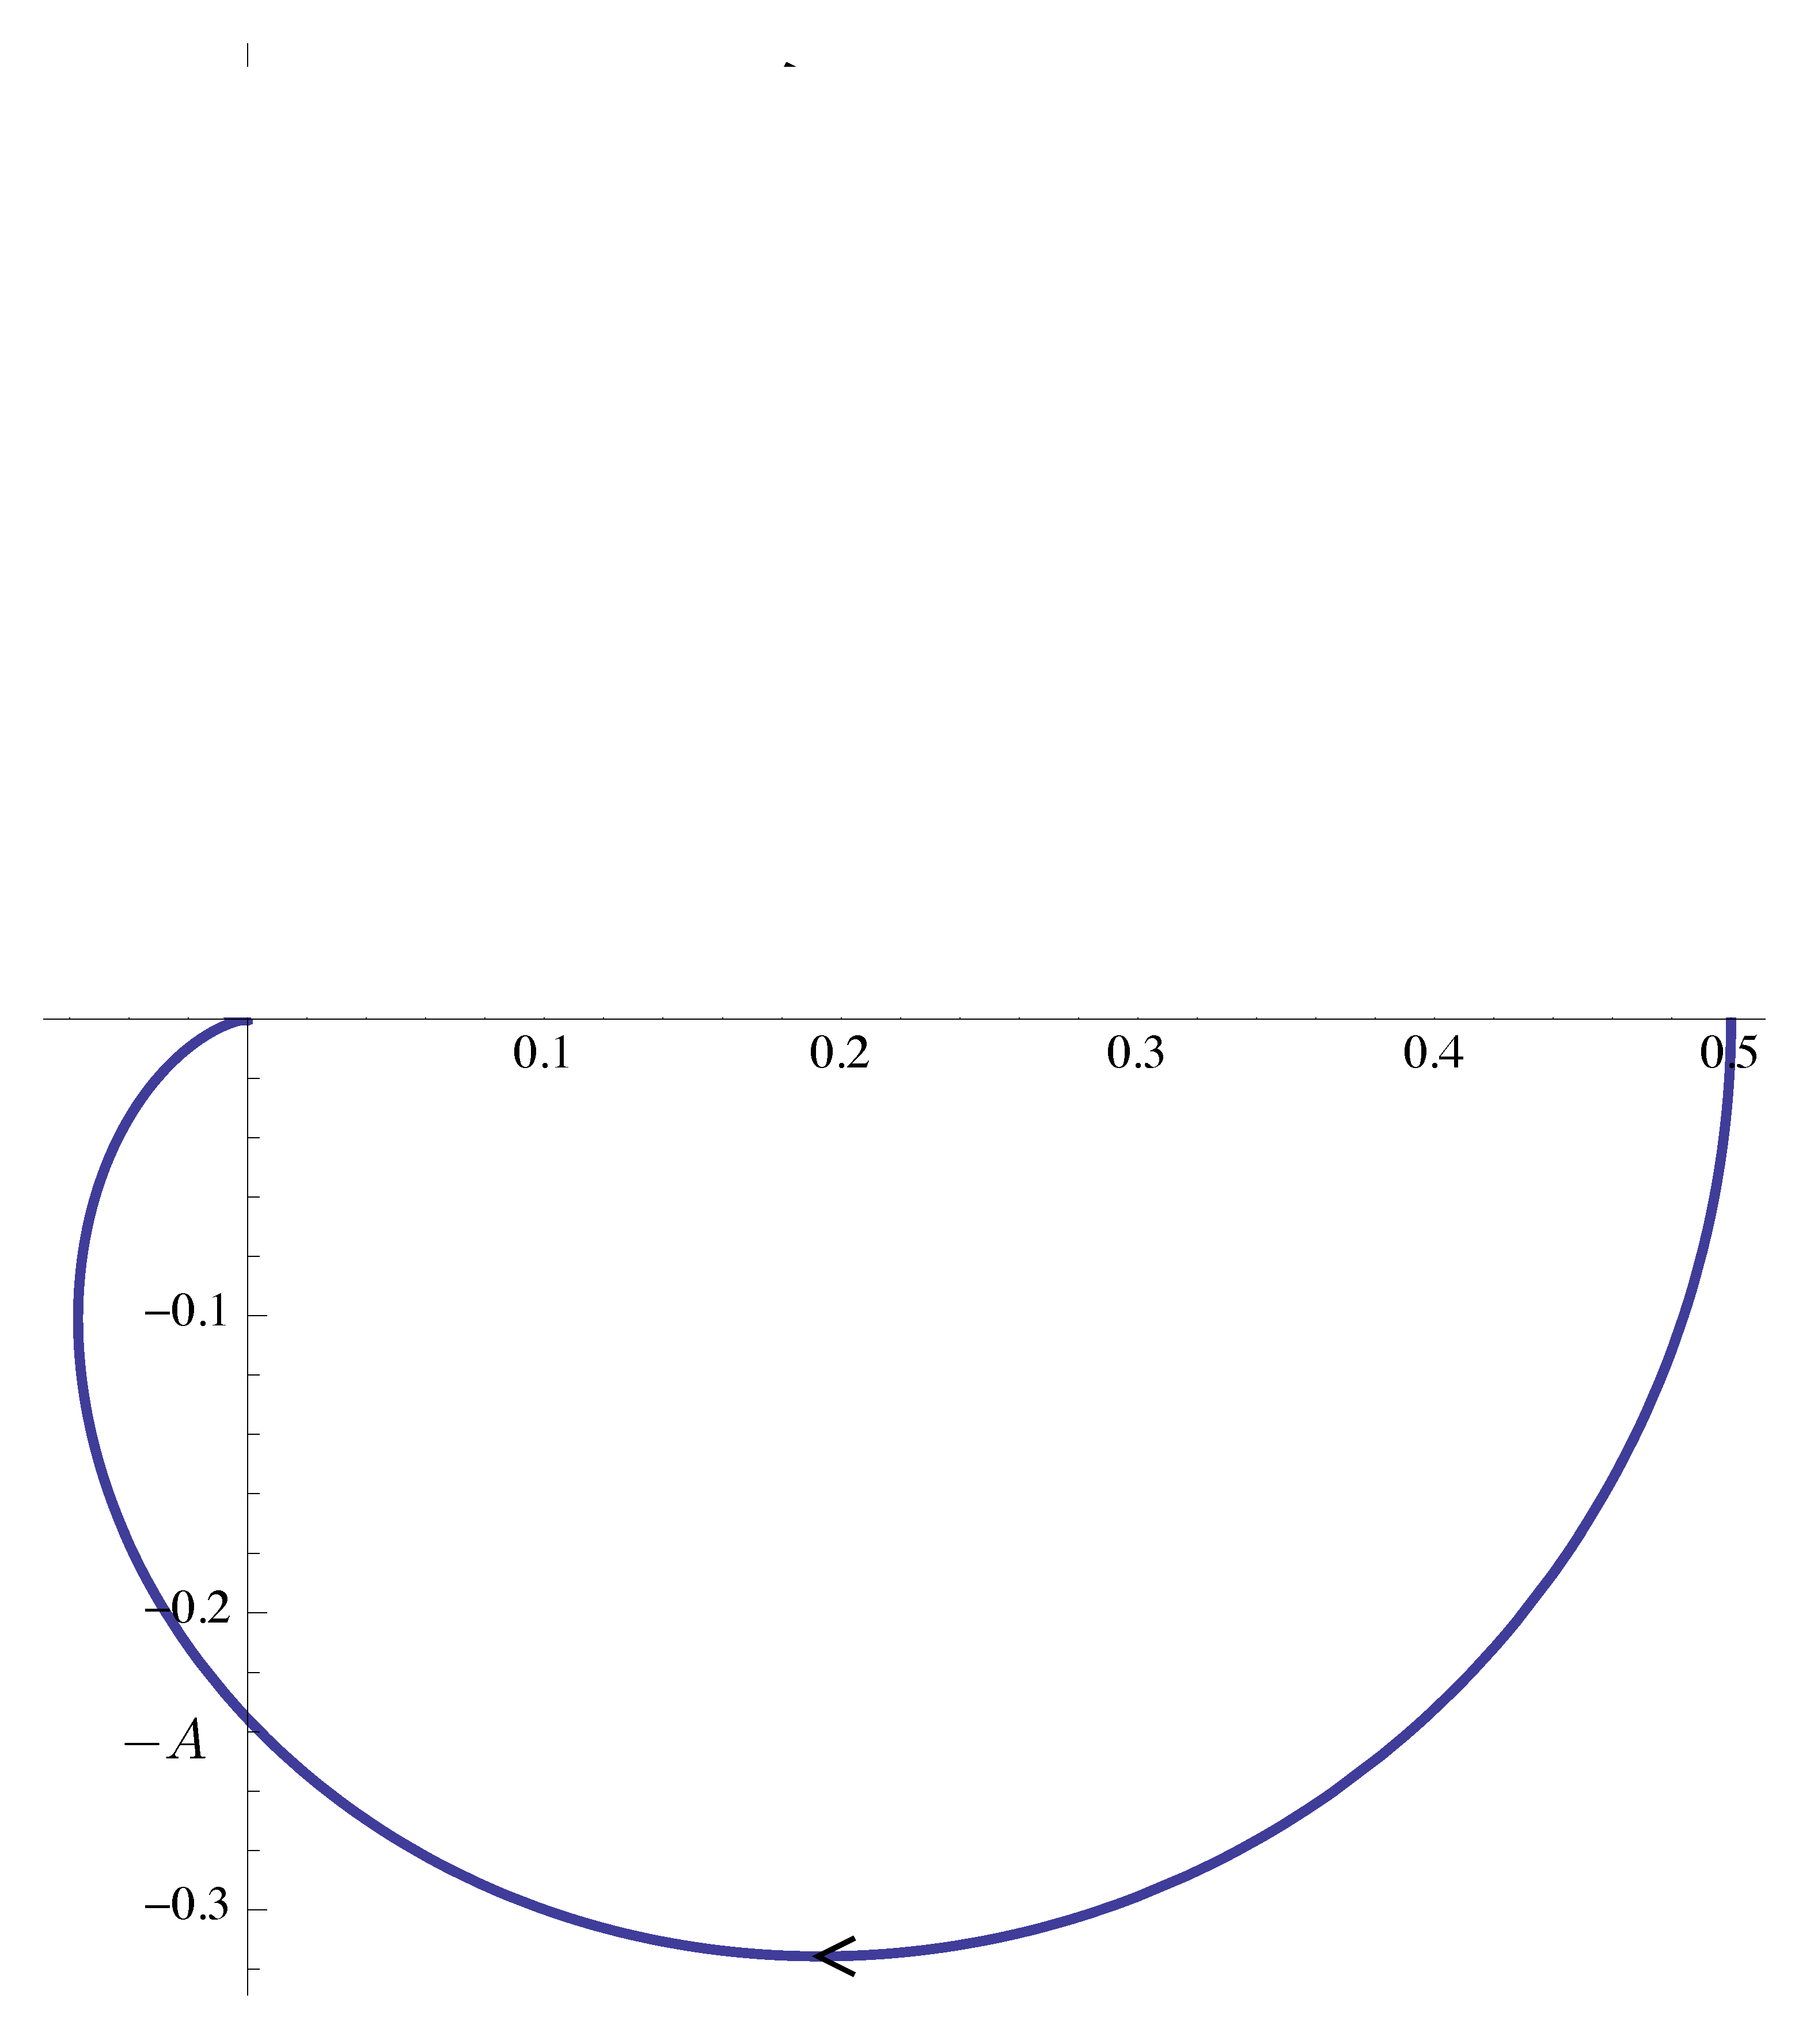
Figure 12: Half of Nyquist plot of \(G(j\omega)\)
But this gives only half of the entire Nyquist plot. Note by symmetry
\[ G(-j\omega) = \overline{G(j\omega)}. \]
We complete the Nyquist plot by taking the conjugate of the obtained half from Figure 12. Thus Figure 13.
\[ \left( \text{Re } G(j\omega), \text{Im } G(j\omega)\right) \text{ for } -\infty < \omega < \infty. \]
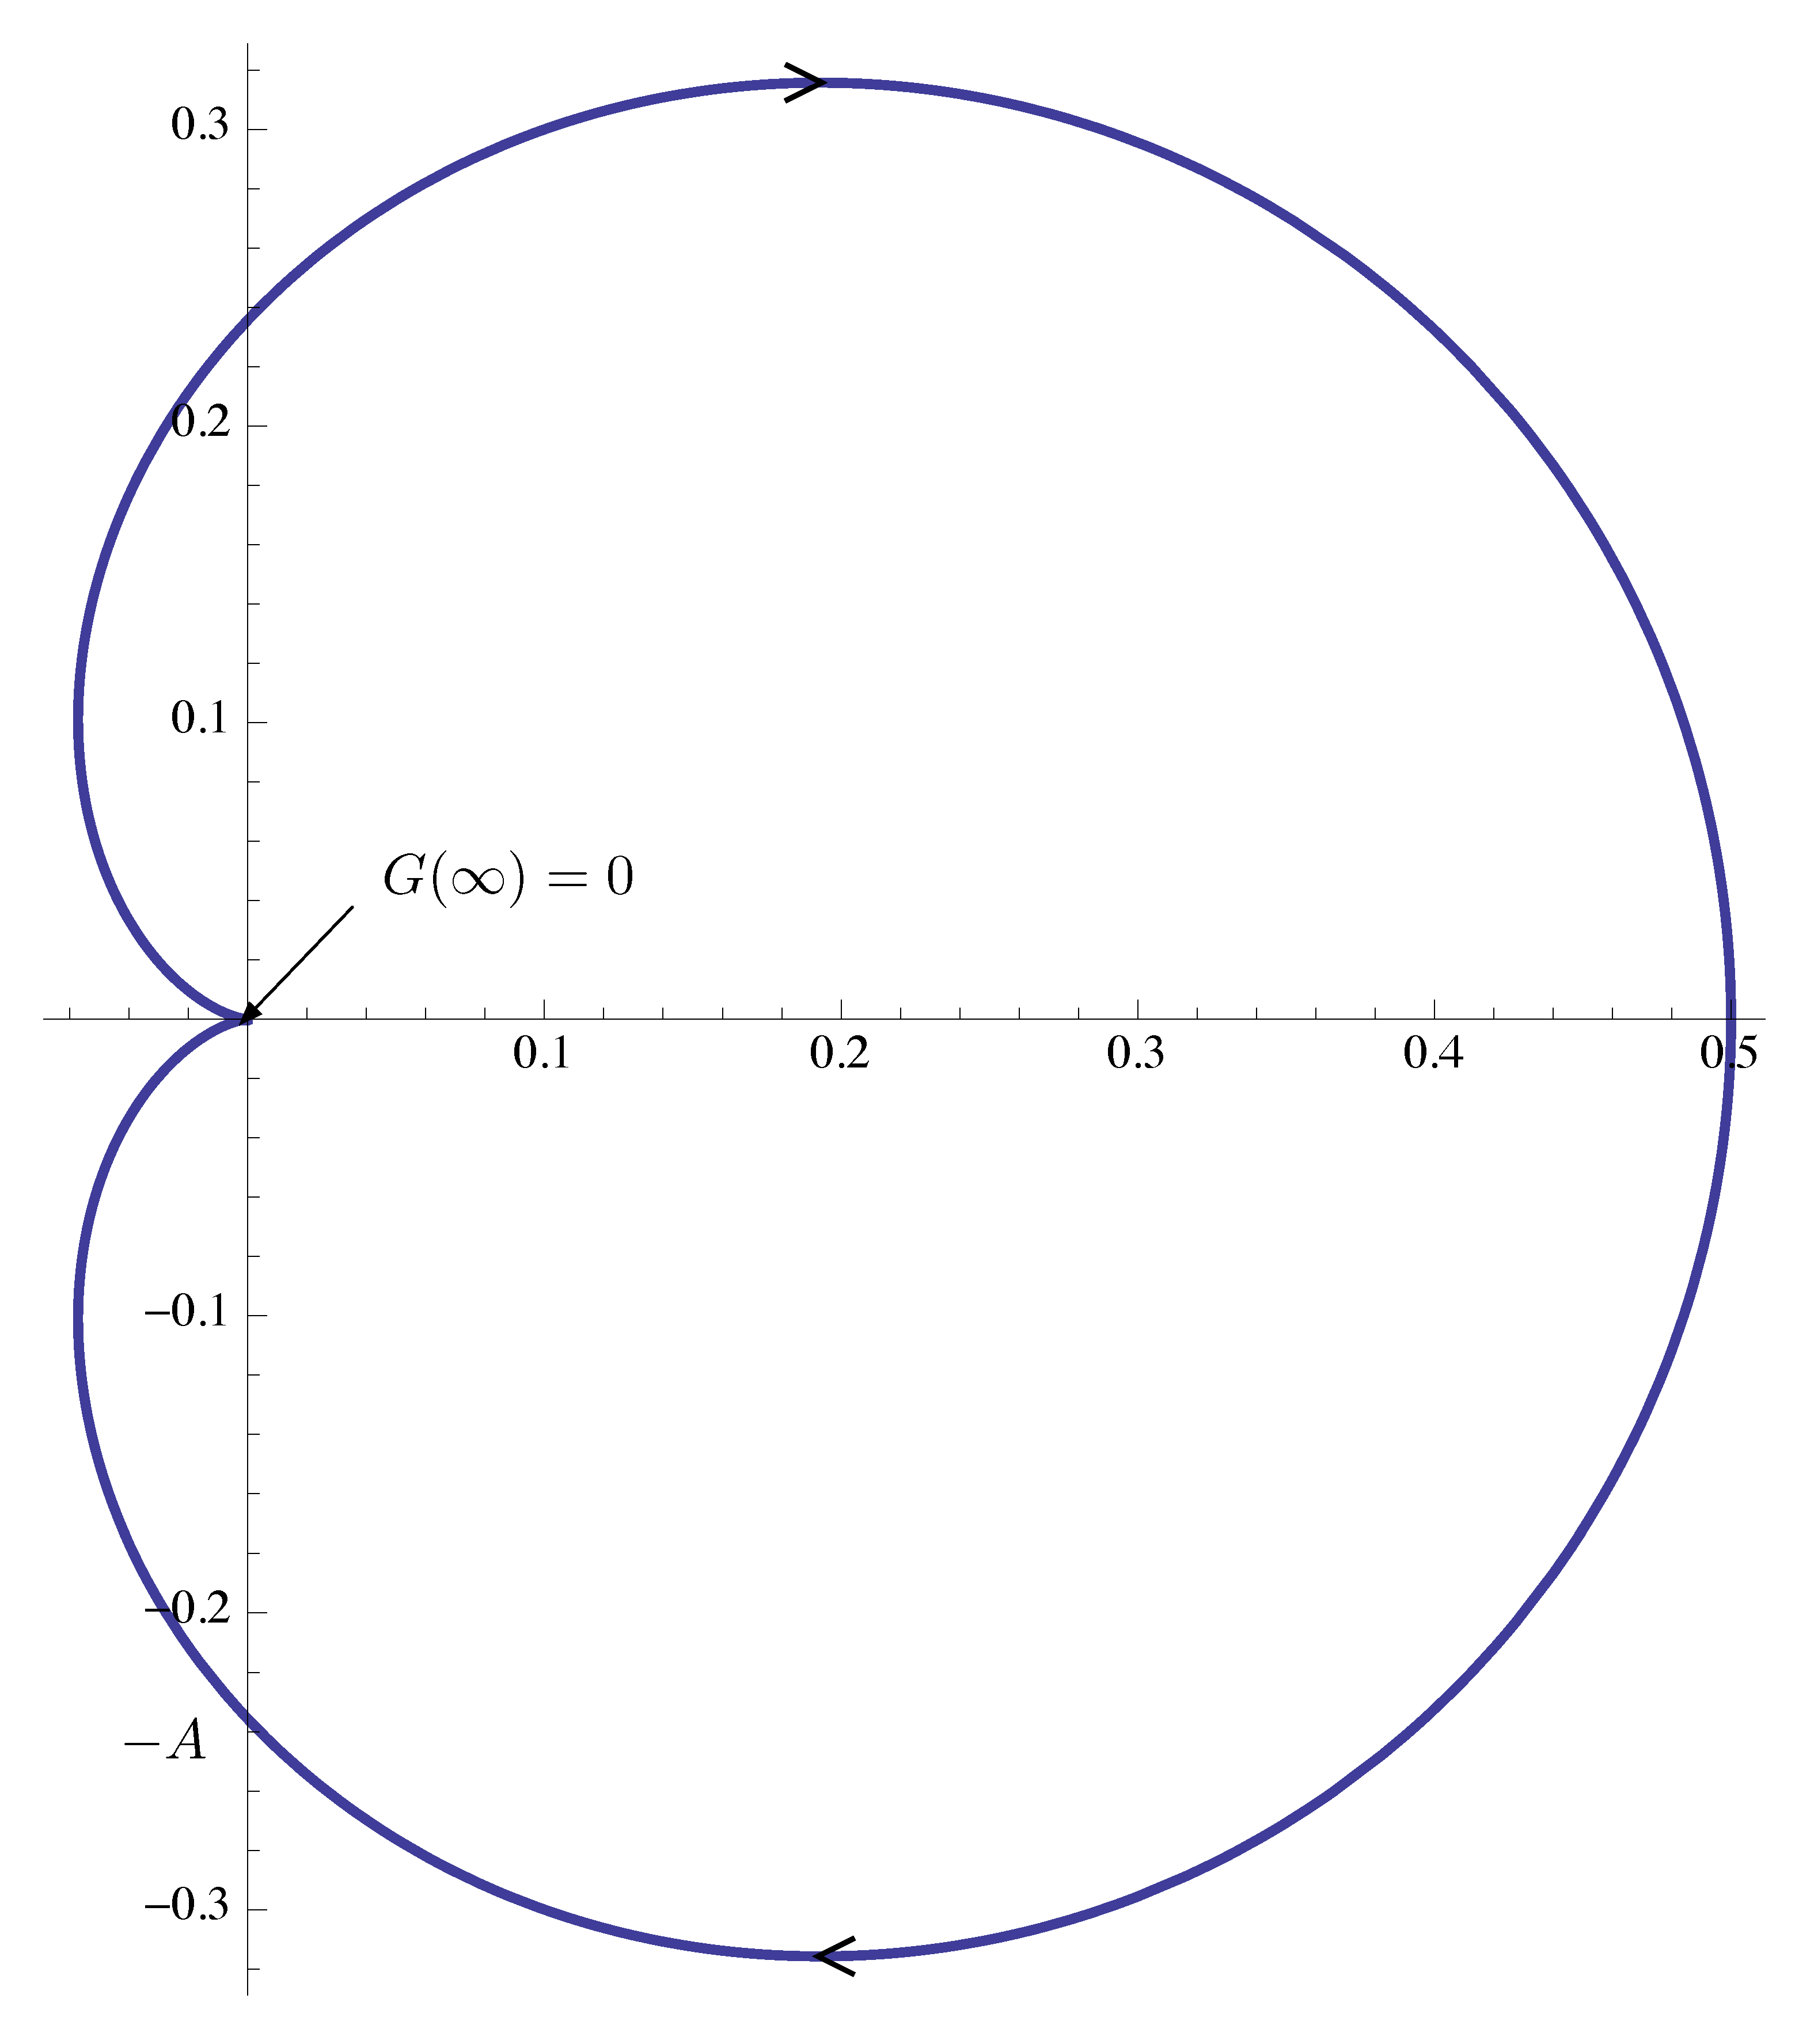
Figure 13: Nyquist plot of \(G(j\omega)\)
Nyquist plots are always symmetric with respect to the real axis. (Conjugacy means reflection with respect to real axis.)
By Nyquist stability criterion,
\begin{align*} &\#(\circlearrowright \text{ of $-1/K$}) \\ &= \#(\text{RHP CL poles}) - \underbrace{\#(\text{RHP OL poles})}_{=0}. \end{align*}Since \(G(s)\) does not have any RHP open loop poles, \(K \in \RR\) is stabilizing if and only if
\begin{align*} \#(\circlearrowright \text{ of $-1/K$}) = 0. \end{align*}- If \(-\frac{1}K < 0\), i.e., \(K > 0\), then $\#(\circlearrowright \text{ of $-1/K$}) = 0$.
- If \(0 < -\frac{1}K < 0.5\), $\#(\circlearrowright \text{ of $-1/K$}) > 0$.
- If \(-\frac{1}K > 0.5\), i.e., \(K > -2\), then we also have $\#(\circlearrowright \text{ of $-1/K$}) = 0$.
Combining the three cases, \(K > -2\) guarantees the closed loop stability.
Example 2: Repeat Example 1 with
\begin{align*} G(s) &= \frac{1}{(s-1)(s^2 + 2s + 3)} \\ &= \frac{1}{s^3 +s^2 + s -3}. \end{align*}Solution: First off, we solve the problem using Routh criterion. The characteristic polynomial is
\[ s^3 + s^2 + s + K - 3, \]
a third degree polynomial.
It is stable if and only if \(K - 3 > 0\) and \(1 \cdot > K-3\). Therefore the range of stabilizing \(K\) is \(3 < K < 4\).
Next we try to recover the range this using the Nyquist criterion.
The Bode plot of \(G(j\omega)\) is shown in Figure 14.
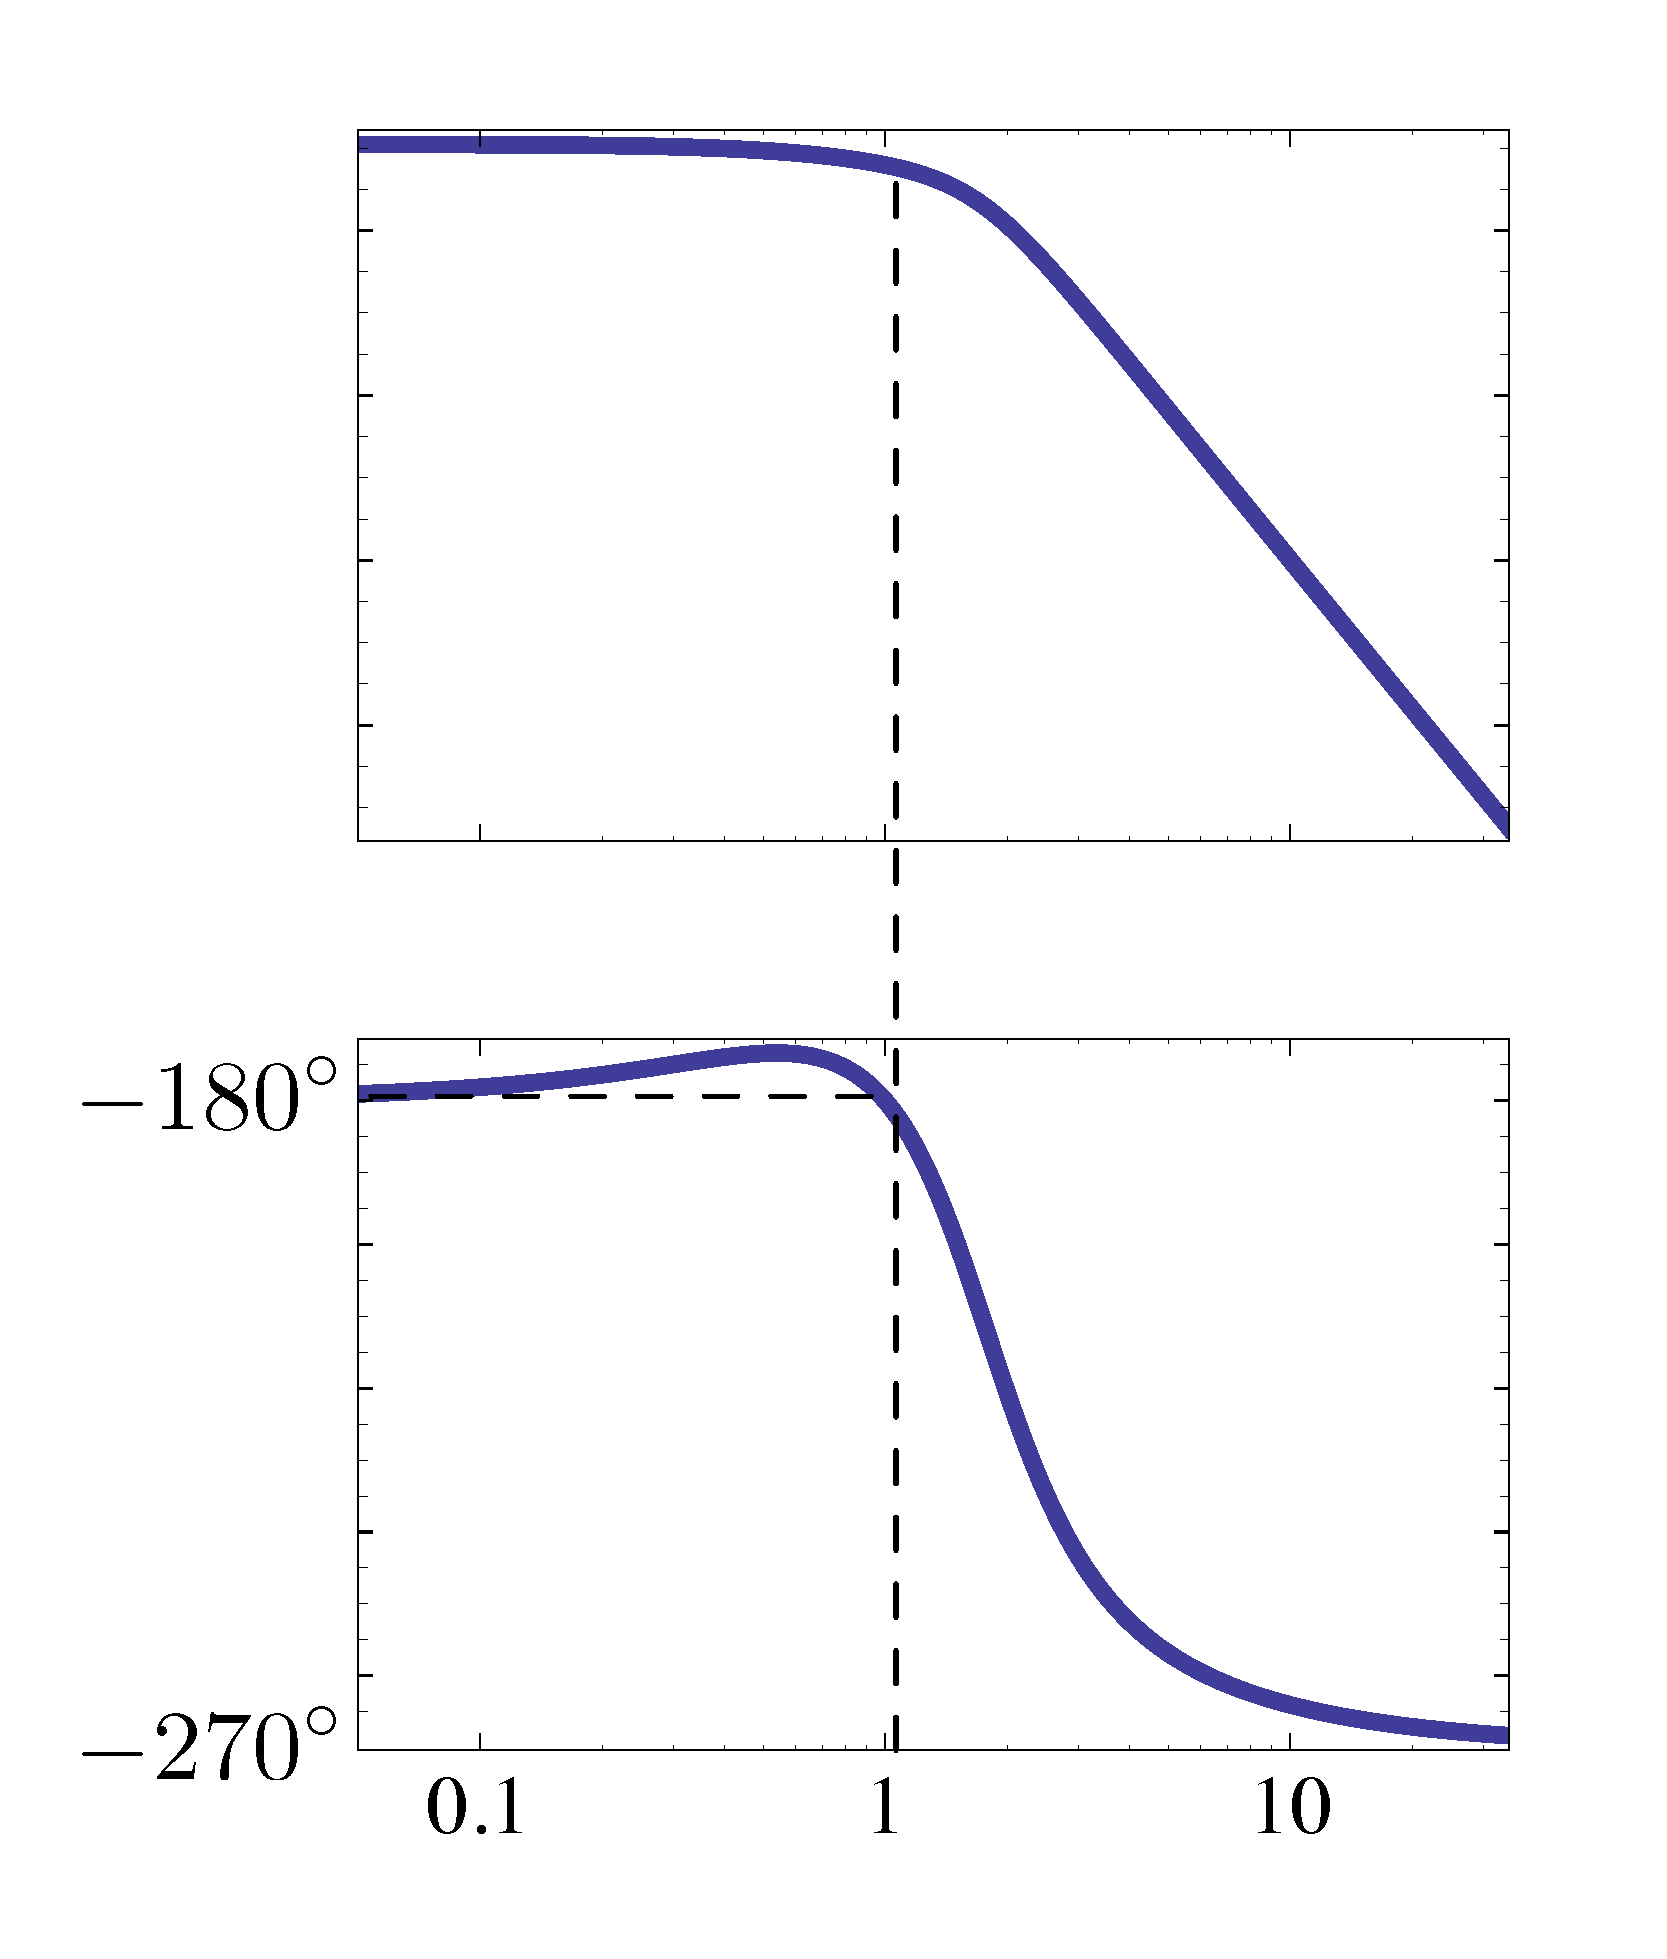
Figure 14: Bode plot of \(G(j\omega)\)
Using its Bode plot as a guideline, we can sketch the Nyquist plot of \(G(j\omega)\).
- When \(\omega = 0\), its magnitude is \(M = \frac{1}3\) and phase \(\phi = -180^\circ\).
- When \(\omega = 1\), its magnitude is \(M = \frac{1}4\) and phase \(\phi = -180^\circ\).
We obtain the first portion of the Nyquist plot as shown in Figure 15.
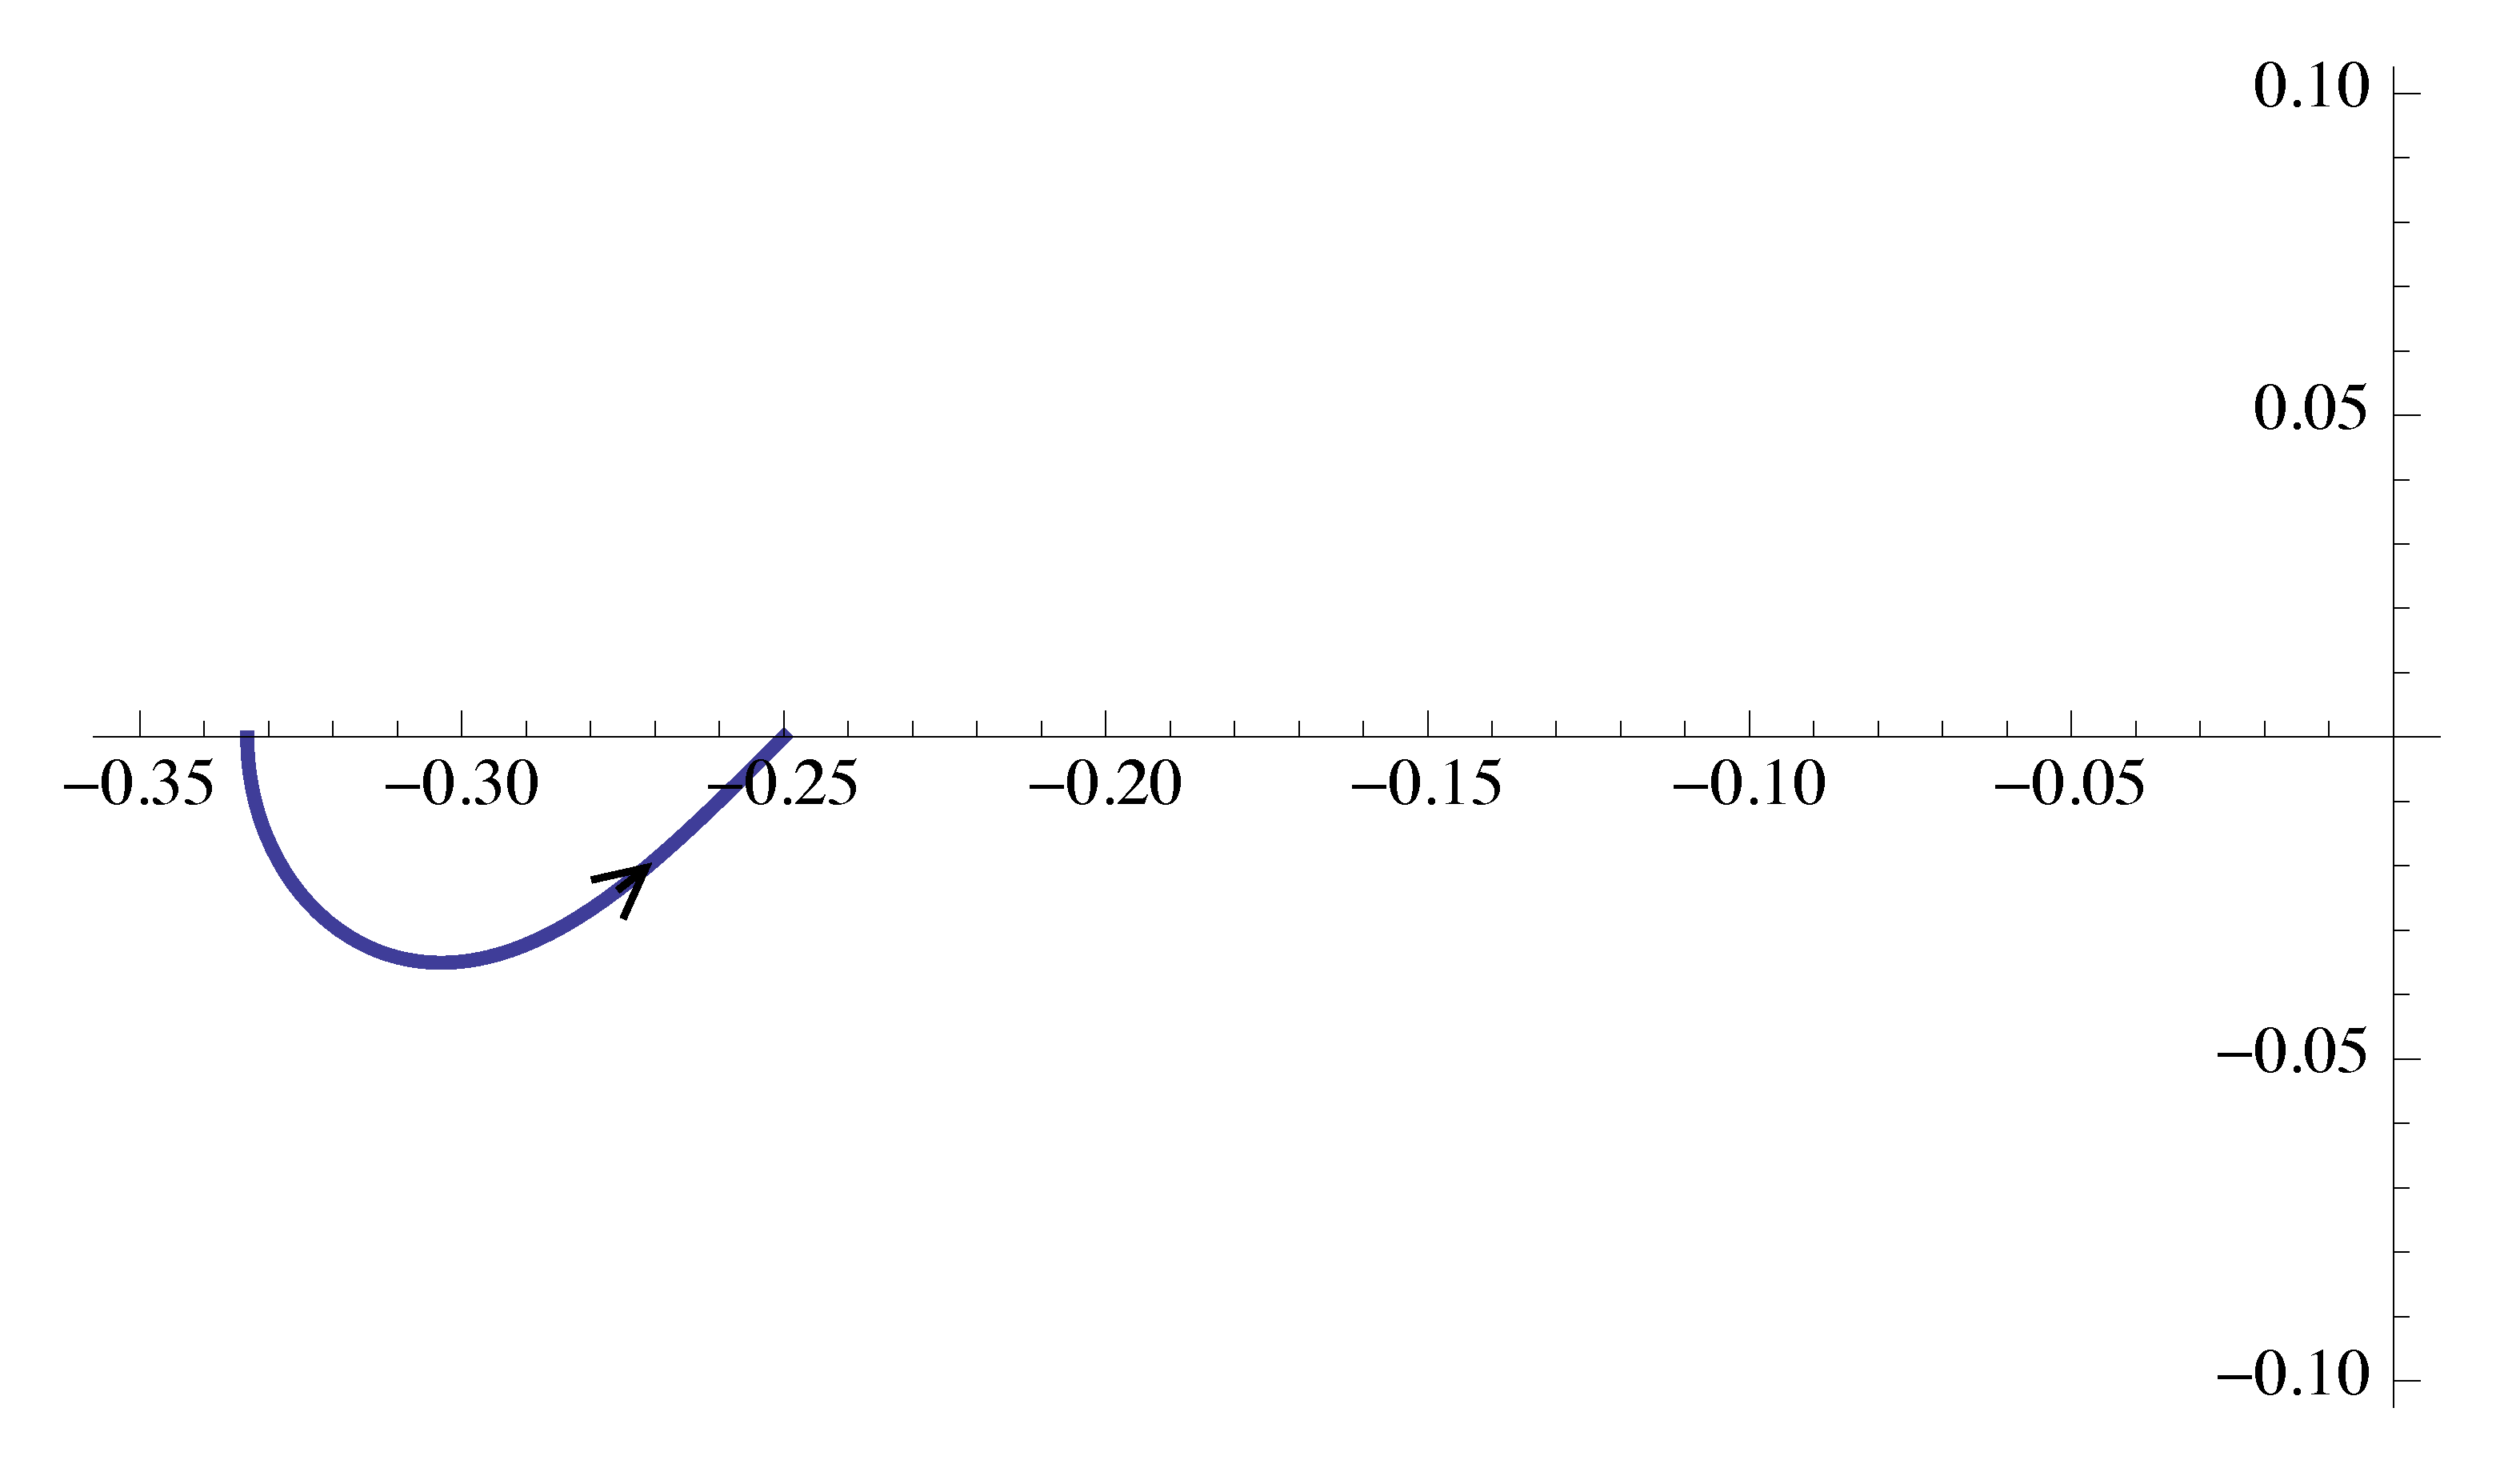
Figure 15: Nyquist plot of \(G(j\omega)\), part 1
- When \(\omega \to \infty\), its magnitude \(M \to 0\) and phase \(\phi \to -270^\circ\).
We further obtain the second portion of the Nyquist plot as shown in Figure 16.
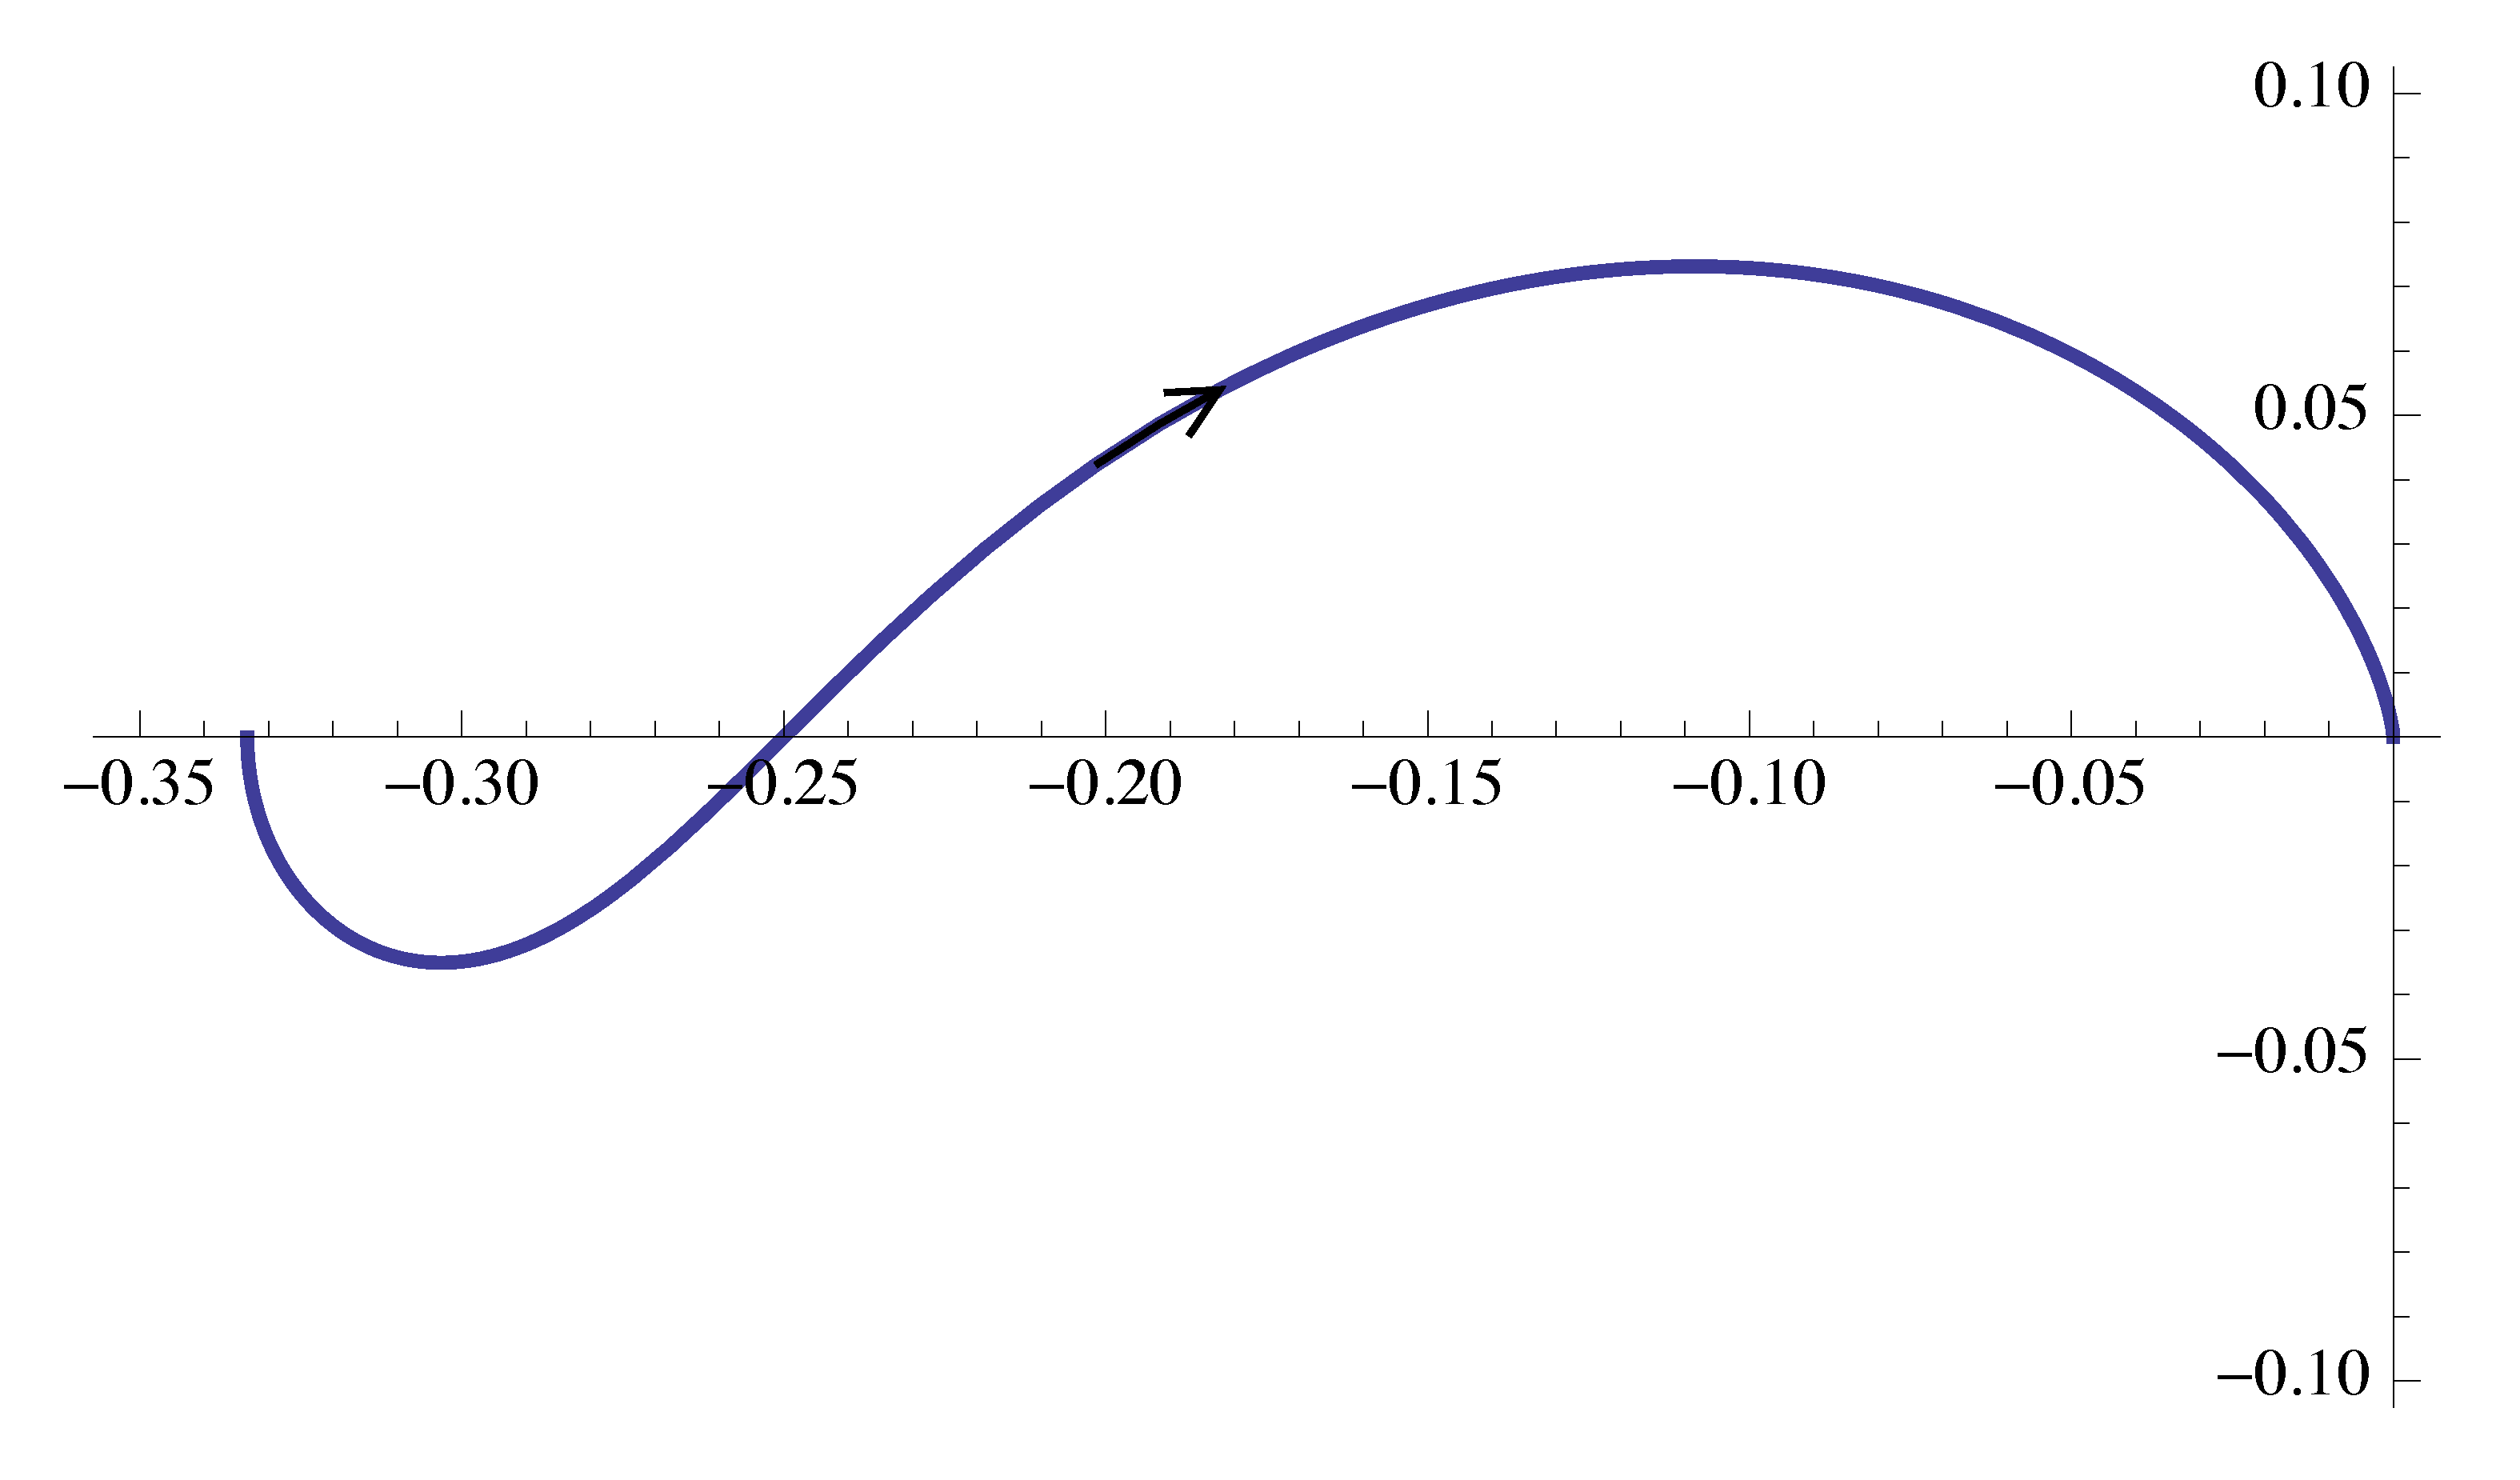
Figure 16: Nyquist plot of \(G(j\omega)\), part 2
- Use the reflection with respect to the real axis to complete the Nyquist plot for \(-\infty < \omega < +\infty\). Nyquist plot of \(G(j\omega)\) is shown in Figure 17.
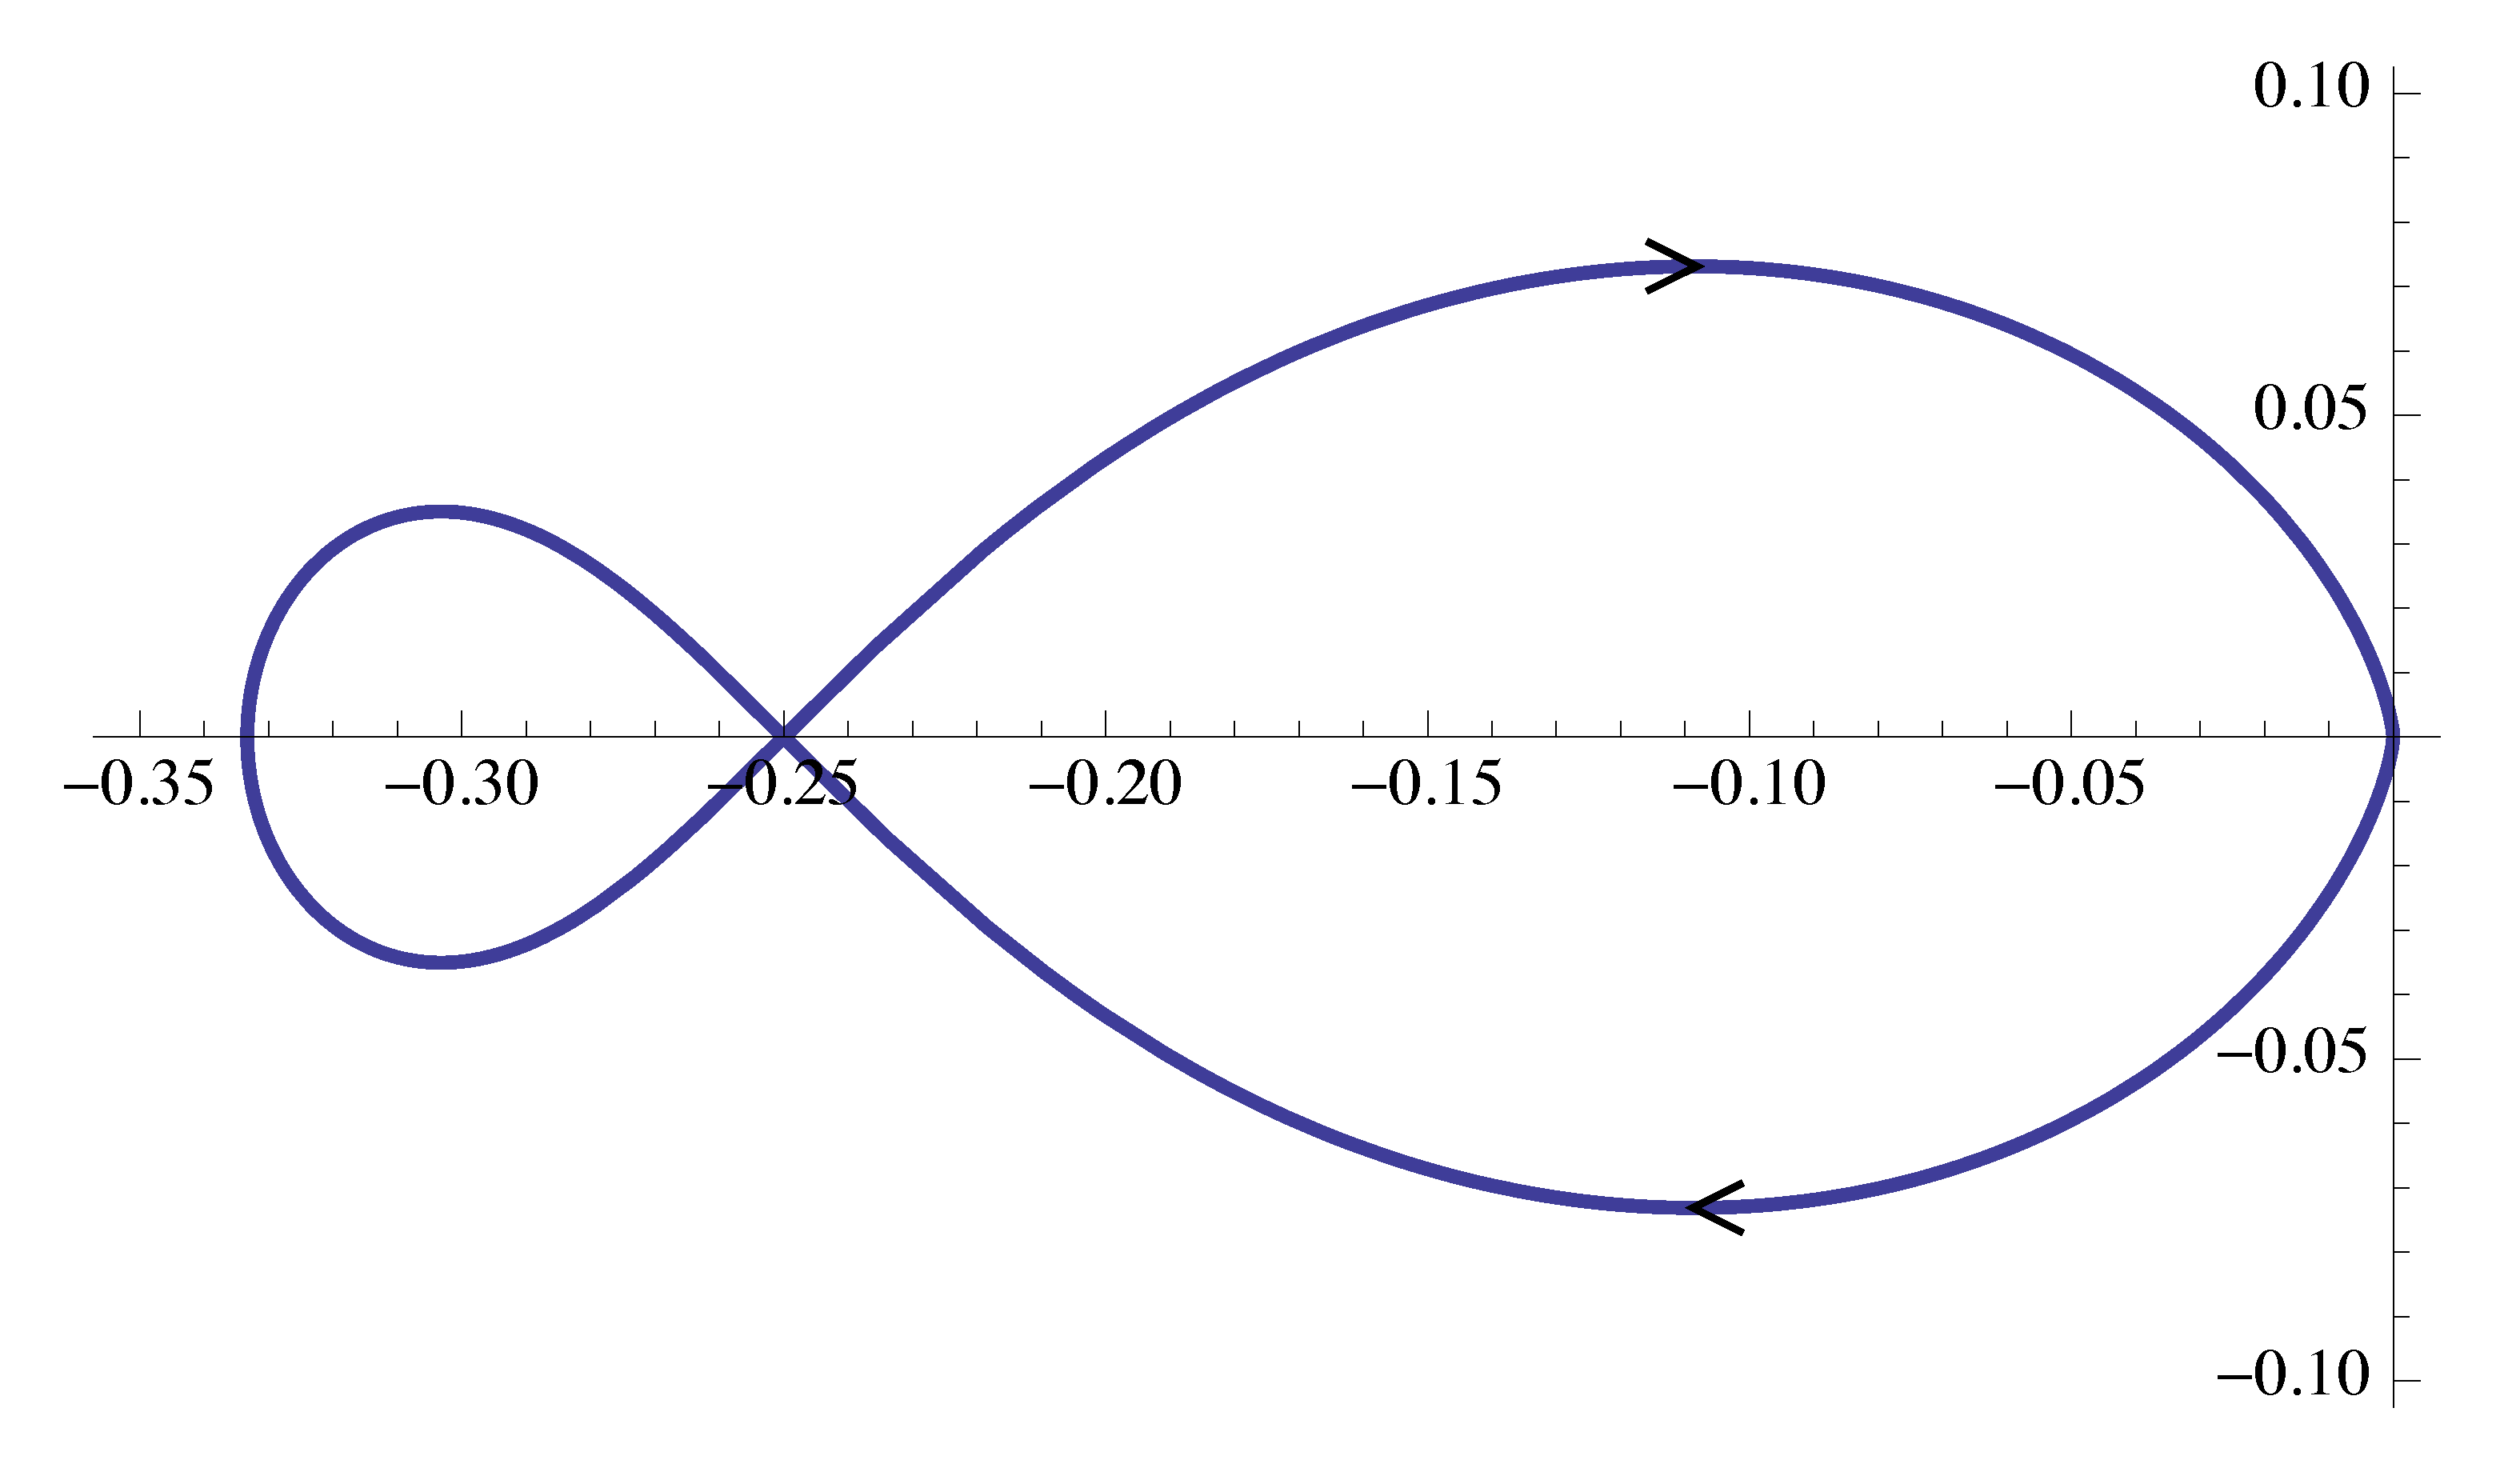
Figure 17: Nyquist plot of \(G(j\omega)\)
By Nyquist stability criterion,
\[ \#(\circlearrowright \text{ of $-1/K$}) = \#(\text{RHP CL poles}) - \underbrace{\#(\text{RHP OL poles})}_{=1}. \]
#(RHP open loop poles) is \(1\) since \(s = 1\) is a Right Half Plane pole.
Therefore \(K \in \RR\) is stabilizing if and only if
\begin{align*} \#(\circlearrowright \text{ of $-1/K$}) = -1. \end{align*}Based on the Nyquist plot, three points on the real line divide the real axis into four segments. We want to calculate the encirclements of \(-\frac{1}K\) by \(G(j\omega)\) when \(-\frac{1}K\) falls into each of the segments.
- When \(-\frac{1}K < -\frac{1}3\), i.e., \(0 < K < 3\), $\#(\circlearrowright \text{ of $-1/K$}) = 0$.
- When \(-\frac{1}3 < -\frac{1}K < -\frac{1}4\), i.e., \(3 < K < 4\), $\#(\circlearrowright \text{ of $-1/K$}) = -1$.
- When \(-\frac{1}4 < -\frac{1}K < 0\), i.e., \(K > 4\), $\#(\circlearrowright \text{ of $-1/K$}) = 1$.
- When \(-\frac{1}K > 0\), i.e., $ K < 0 $, $\#(\circlearrowright \text{ of $-1/K$}) = 0$.
We obtain the range for closed stability \(3 < K < 4\). Note we can interpret this range in terms of phase margin. Recall the phase plot of \(G(j\omega)\) in Figure 14.
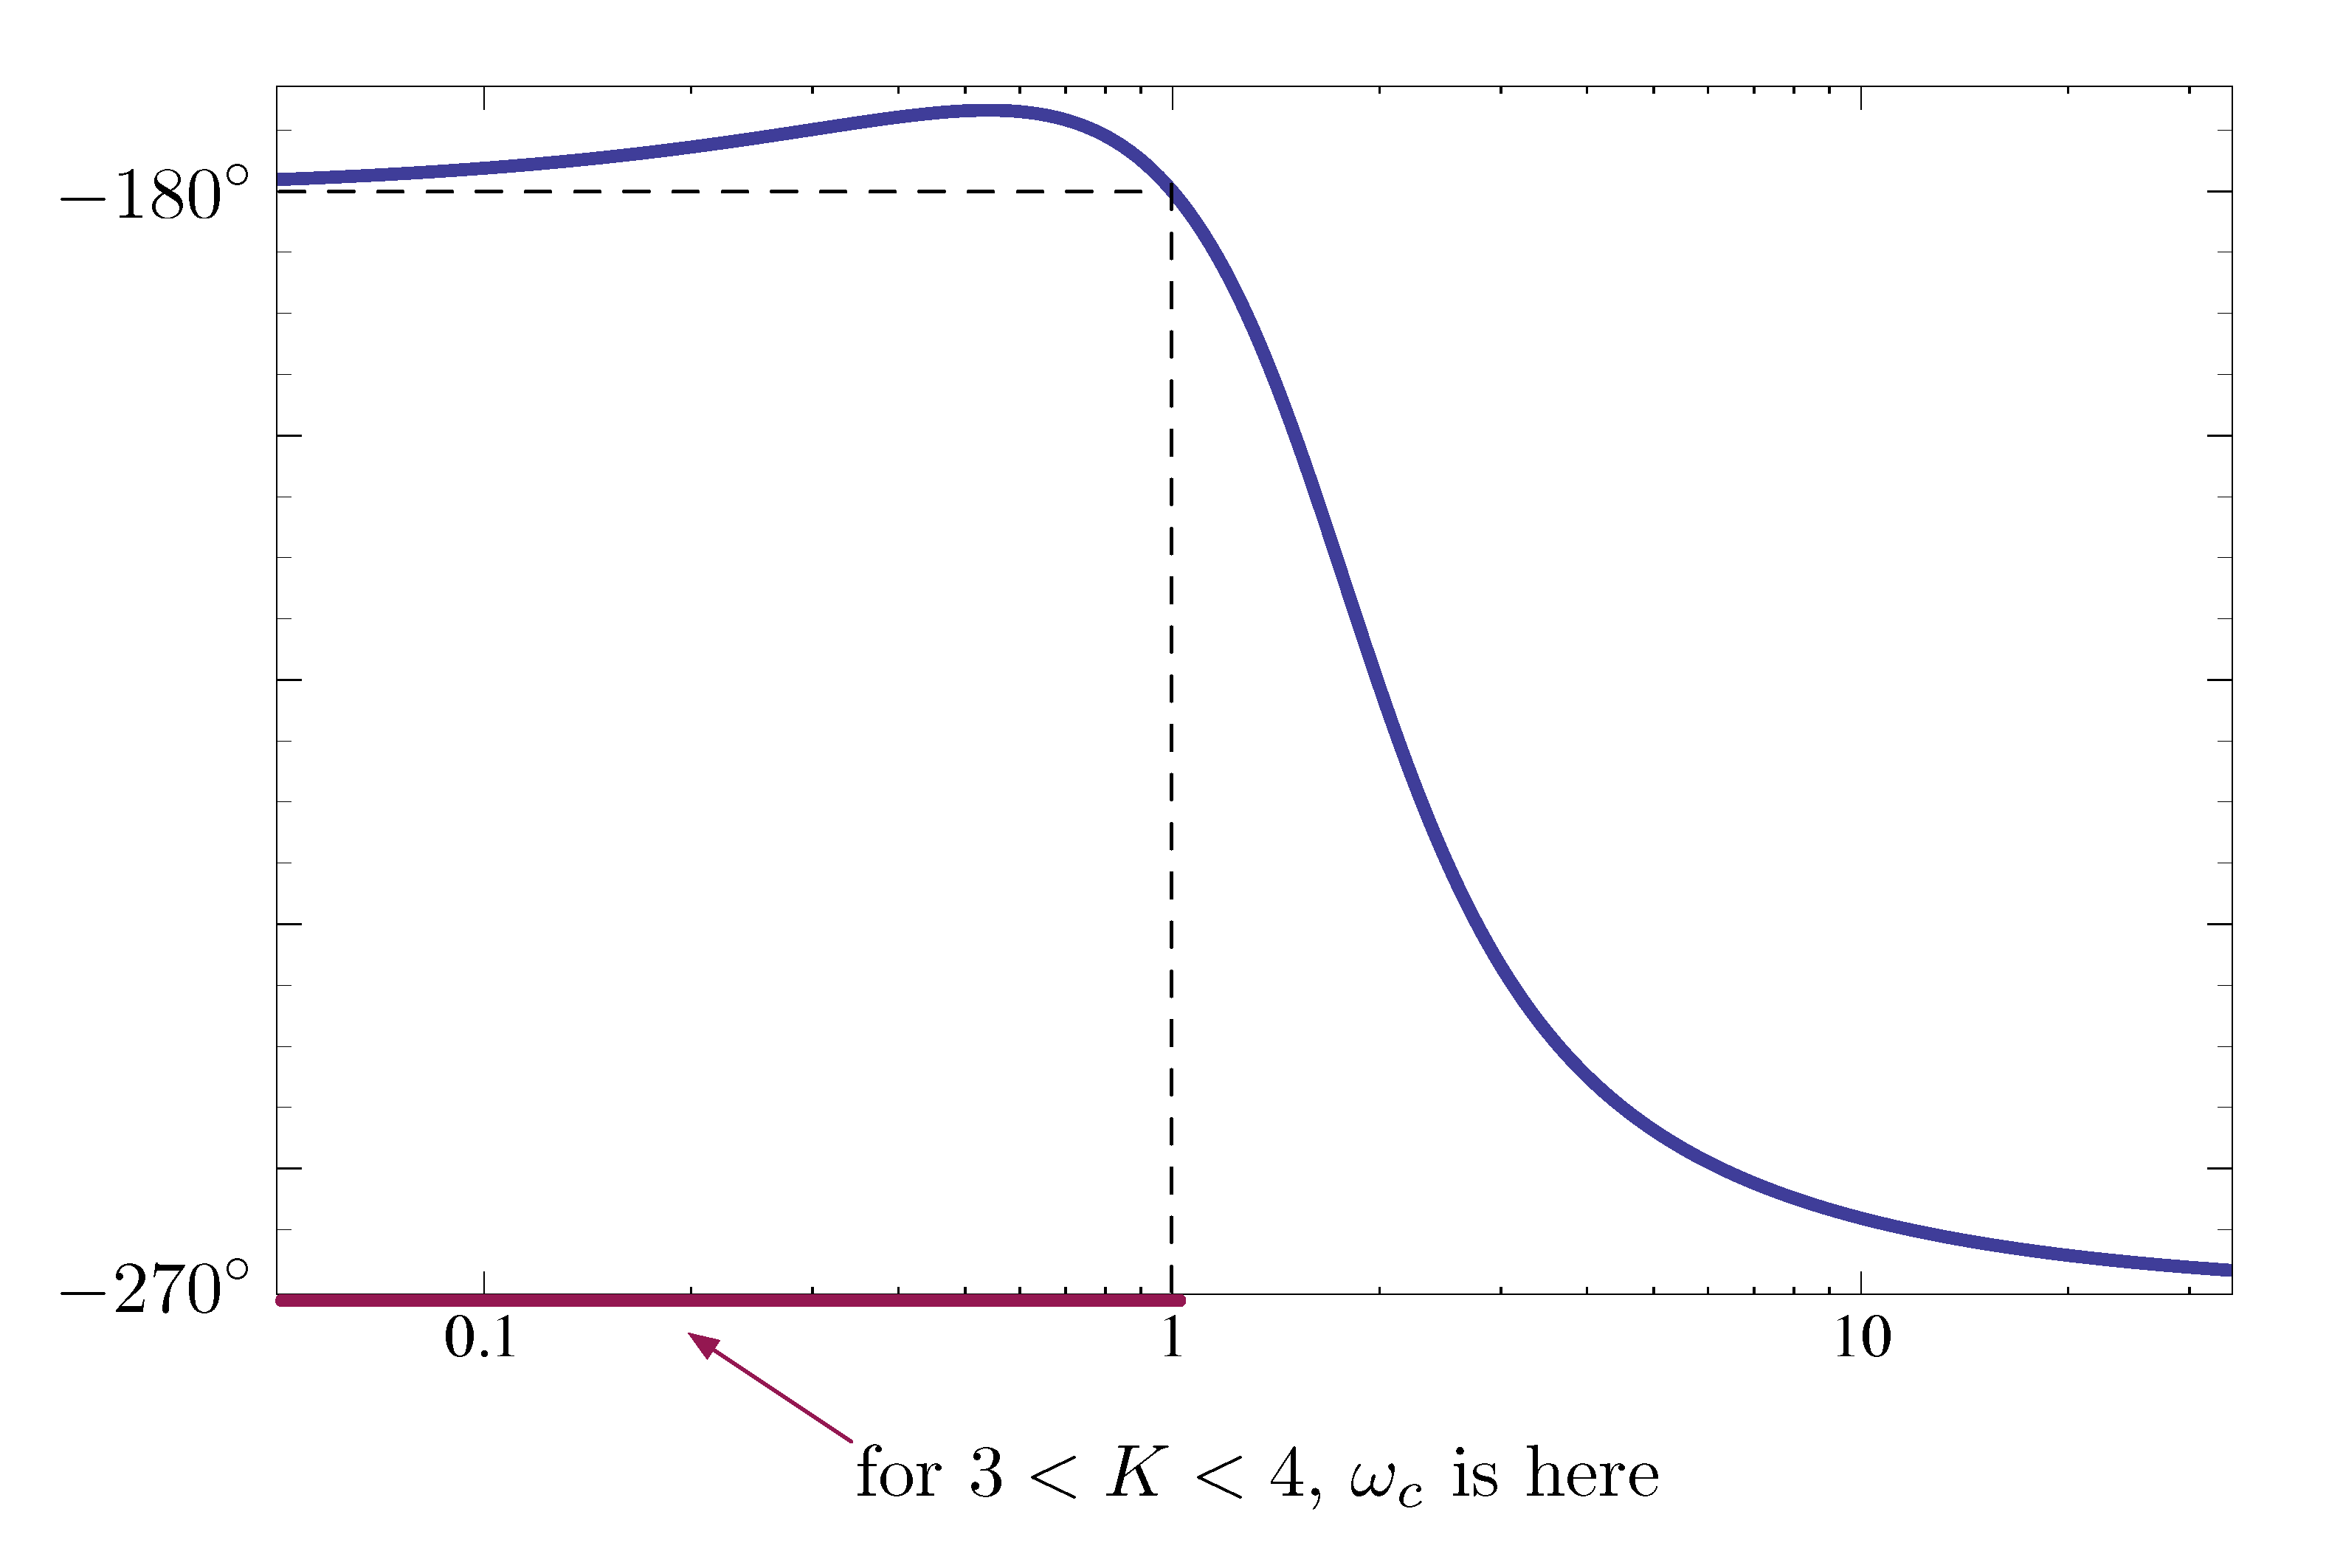
Figure 18: Phase plot of \(G(j\omega)\) and range of \(K\) derived from Nyquist criterion
In this case, we see stability \(\iff\) \({\rm PM} > 0\) (which is typical).
Example 3: Repeat Example 1 with
\begin{align*} G(s) &= \frac{s-1}{(s+2)(s^2 - s+ 1)} \\ &= \frac{s-1}{s^3 + s^2 - s + 2}. \end{align*}Solution: This is a third order system. Again, first we solve for the range of stabilizing \(K\) by Routh test.
The characteristic polynomial is
\begin{align*} & s^3 + s^2 - s + 2 + K(s-1) \\ =\,& s^3 + s^2 + (K-1)s + 2 - K. \end{align*}It is stable if and only if
\begin{align*} & K - 1 > 0 \\ & 2 - K > 0 \\ & 1\cdot (K-1) > 2-K. \end{align*}Therefore, the range of stabilizing \(K\) is \(\frac{3}2 < K < 2\).
Next we use the Nyquist criterion to derive the same range for \(K\).
We notice the open loop poles are
\begin{align*} \begin{array}{ll} s = -2. & \text{(a LHP pole)} \\ s^2 -s +1 = 0 &\\ \left(s-\frac{1}{2}\right)^2 + \frac{3}{4} = 0 &\\ s_{1,2} = \frac{1}{2} \pm j\frac{\sqrt{3}}{2}. &\text{(RHP poles)} \end{array} \end{align*}There are two RHP open loop poles.
Its Bode plot is shown in Figure 19. (A tricky one with RHP poles/zeros.)
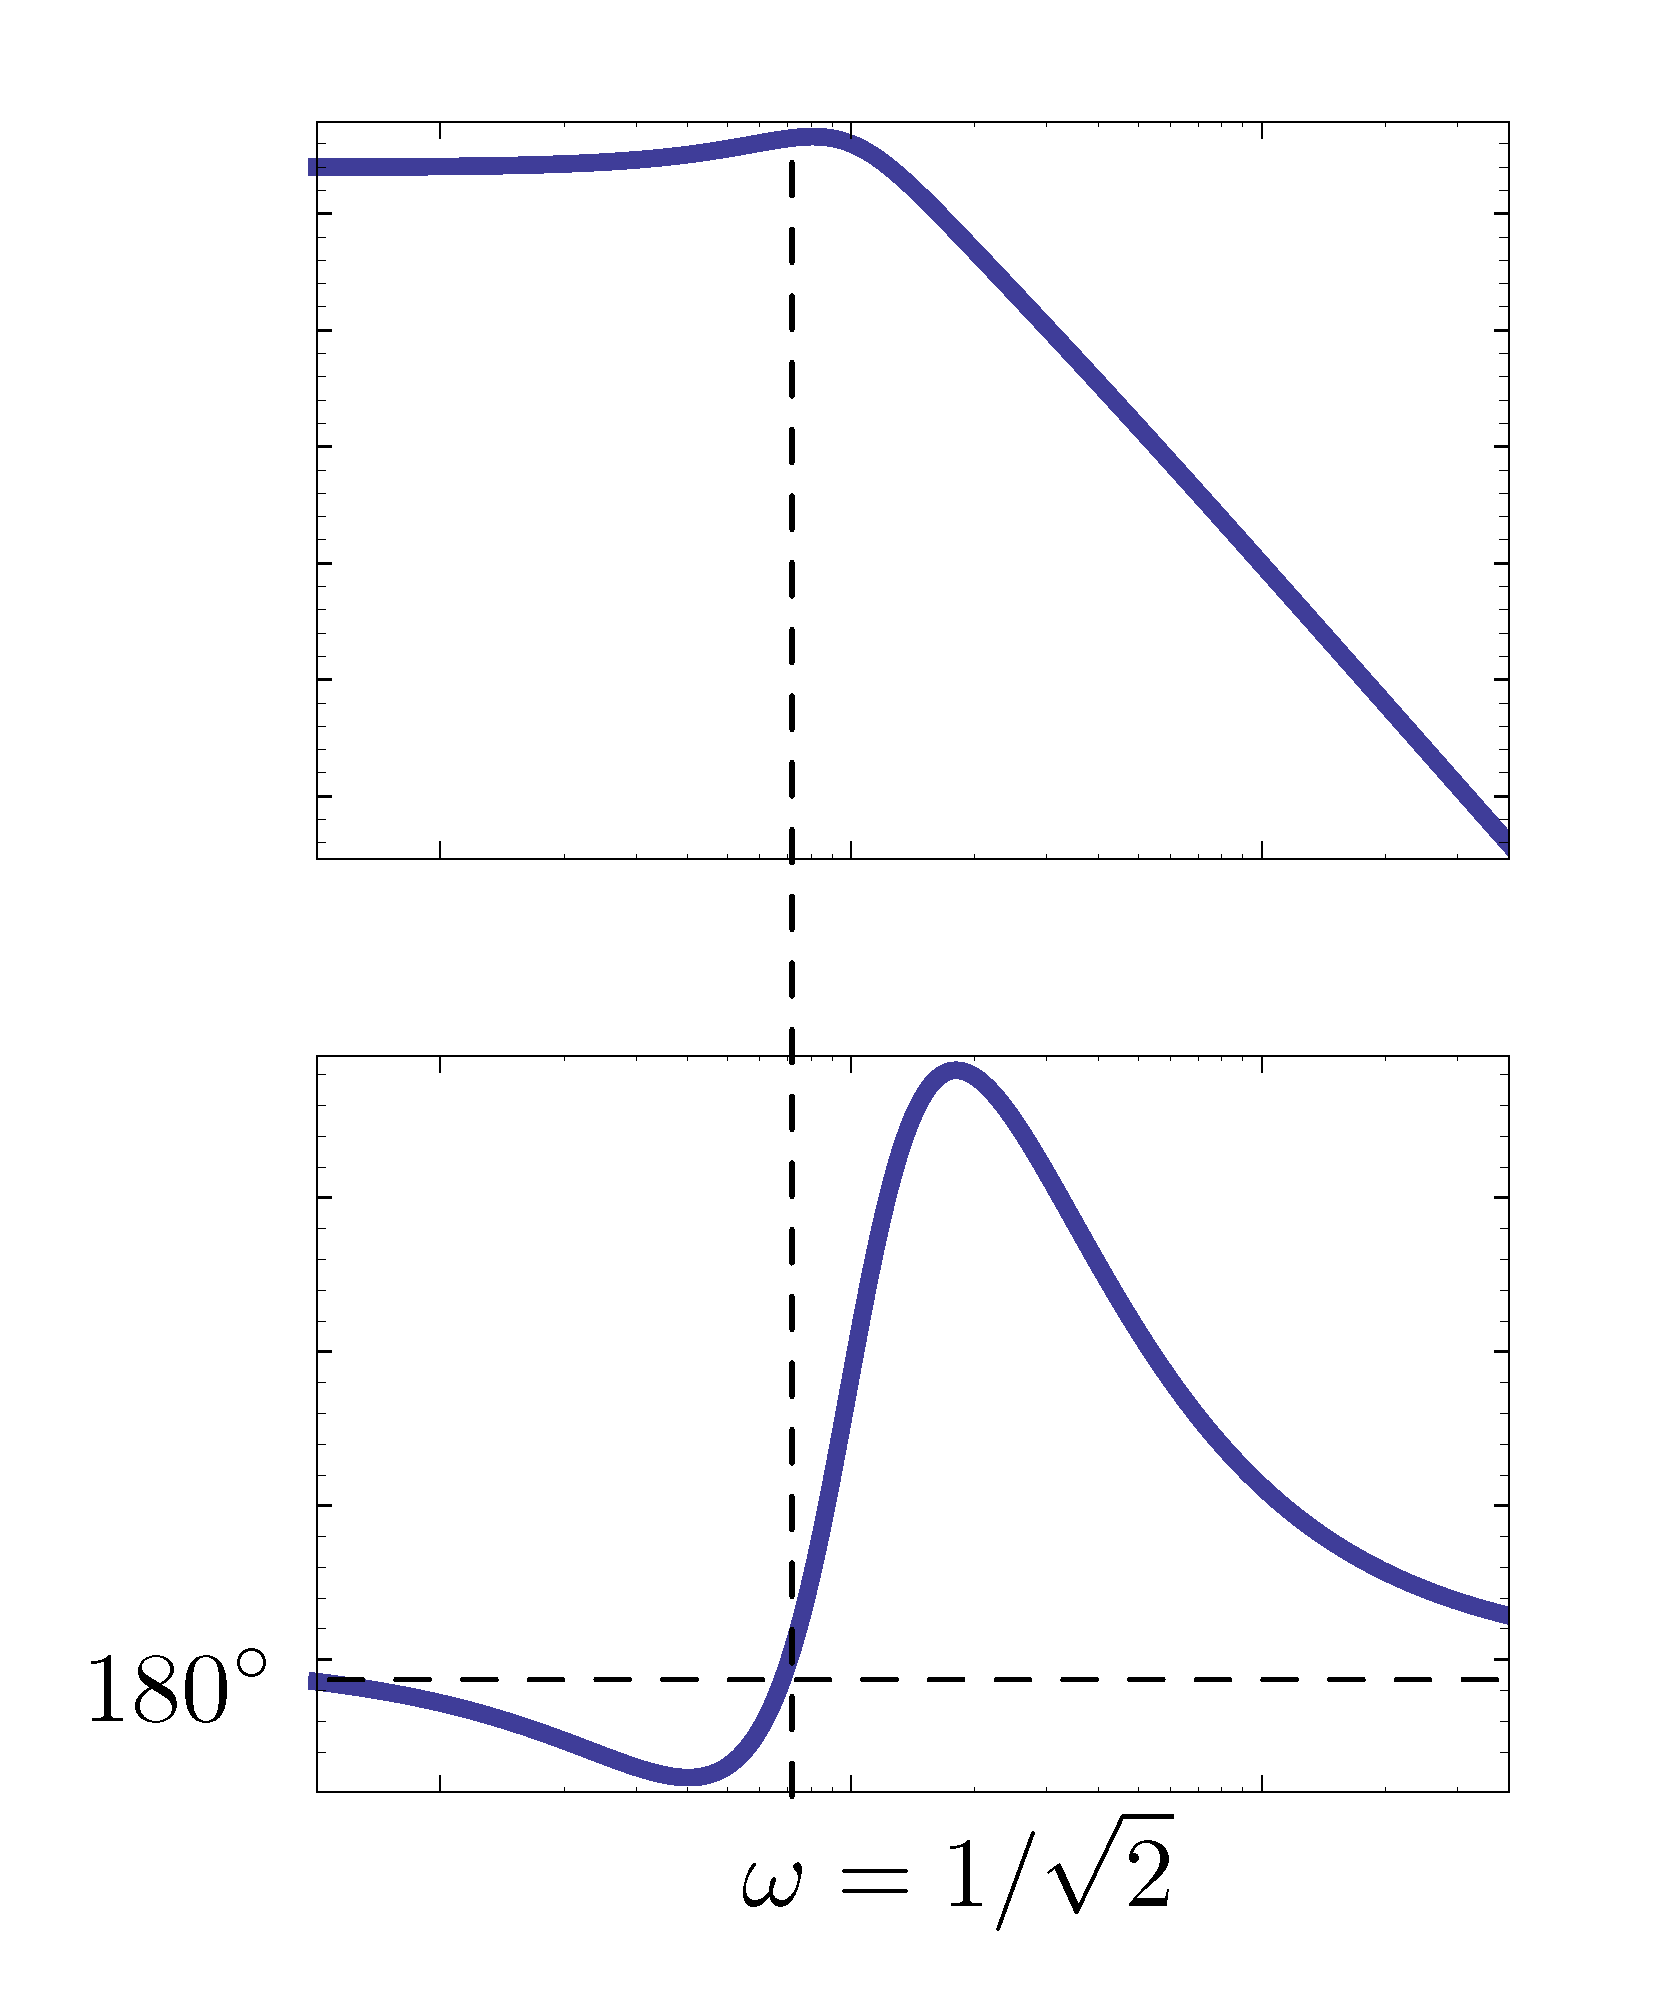
Figure 19: Bode plot of \(G(j\omega)\)
Note \(\phi = 180^\circ\) when
- \(\omega = 0\) and
\(\omega = \frac{1}{\sqrt{2}}\). At the same time, \(G(j\frac{1}{\sqrt{2}})\) is
\begin{align*} & \left. \frac{j\omega+2}{(j\omega-1)((j\omega)^2 - j\omega + 1)}\right|_{\omega = 1/\sqrt{2}} \\ = \, & \frac{\frac{j}{\sqrt{2}}-1}{\left(\frac{j}{\sqrt{2}}+2\right)\left( -\frac{1}{2} - \frac{j}{\sqrt{2}} + 1 \right)} \\ = \, &\frac{\frac{j}{\sqrt{2}}-1}{-\frac{3}{2} \left( \frac{j}{\sqrt{2}}-1\right)} = -\frac{2}{3}. \end{align*}
As for the Nyquist plot,
- When \(\omega = 0\), its magnitude \(M = \frac{1}2\) and phase \(\phi = 180^\circ\).
- When \(\omega = \frac{1}{\sqrt{2}}\), its magnitude \(M = \frac{2}3\) and phase \(\phi = 180^\circ\).
We obtain the first portion of the Nyquist plot as shown in Figure 20.
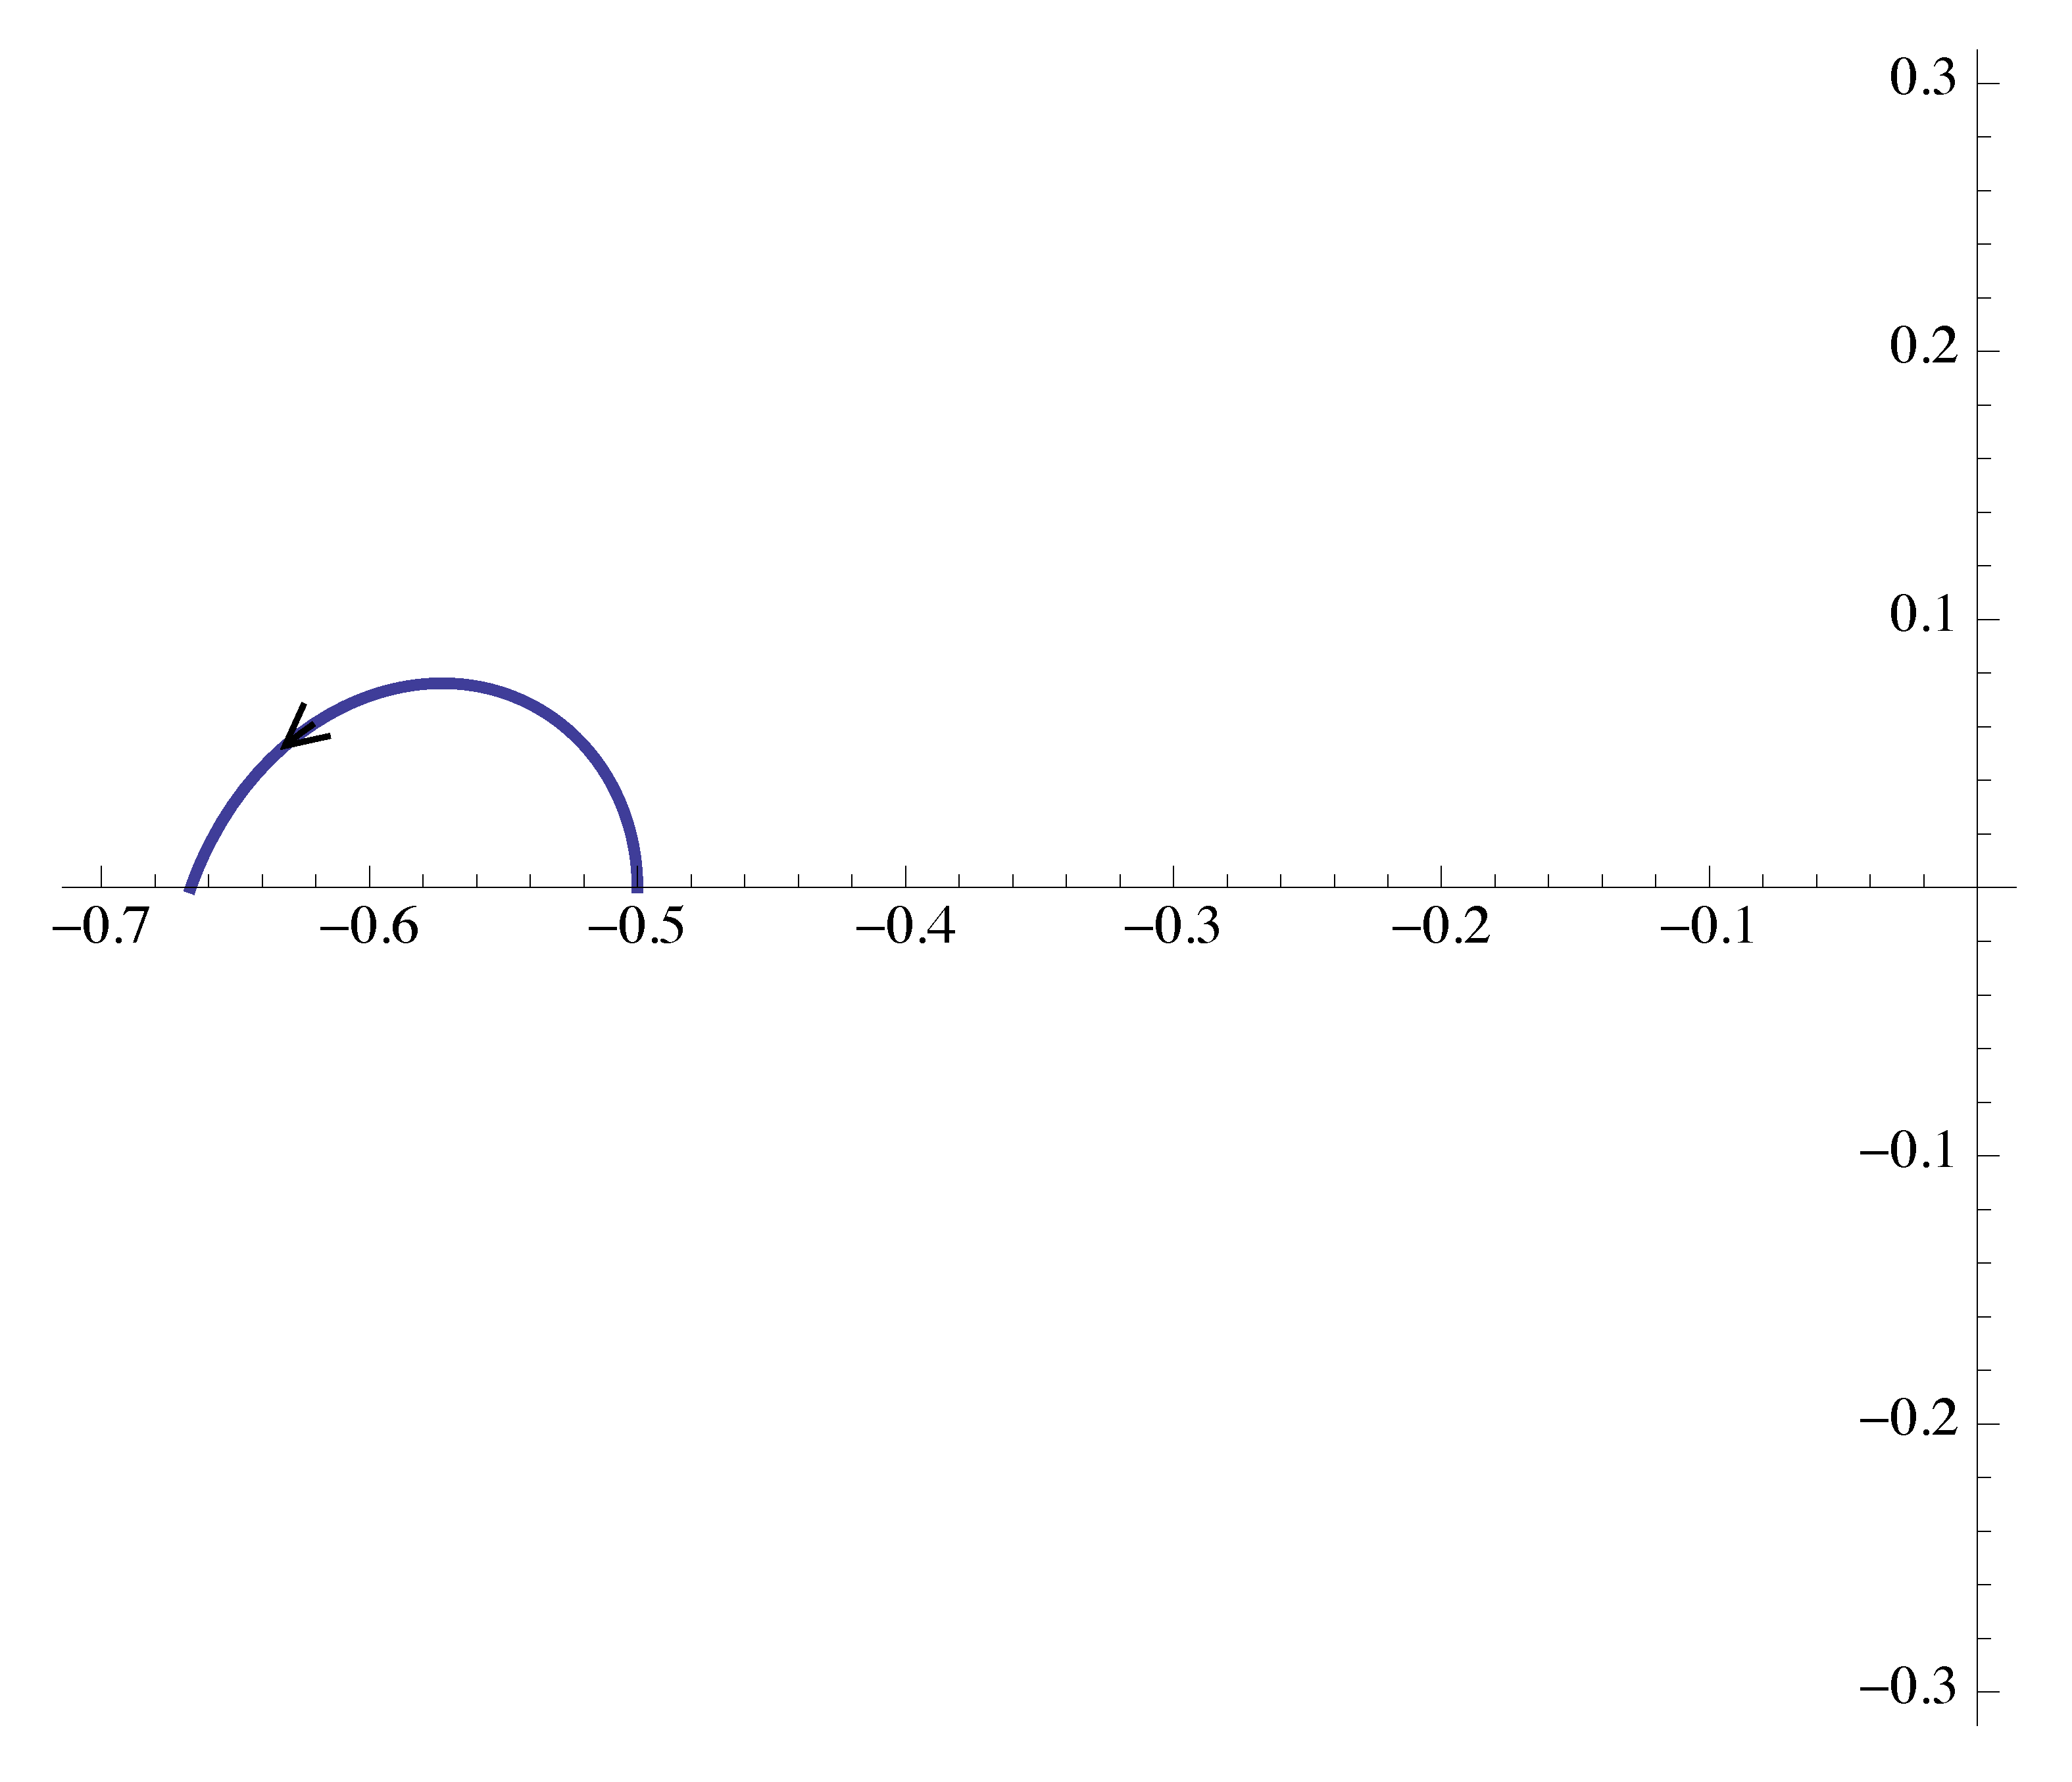
Figure 20: Nyquist plot of \(G(j\omega)\), part 1
- When \(\omega \to \infty\), its magnitude \(M \to 0\) and phase \(\phi \to 180^\circ\).
We further obtain the second portion of the Nyquist plot as shown in Figure 21.
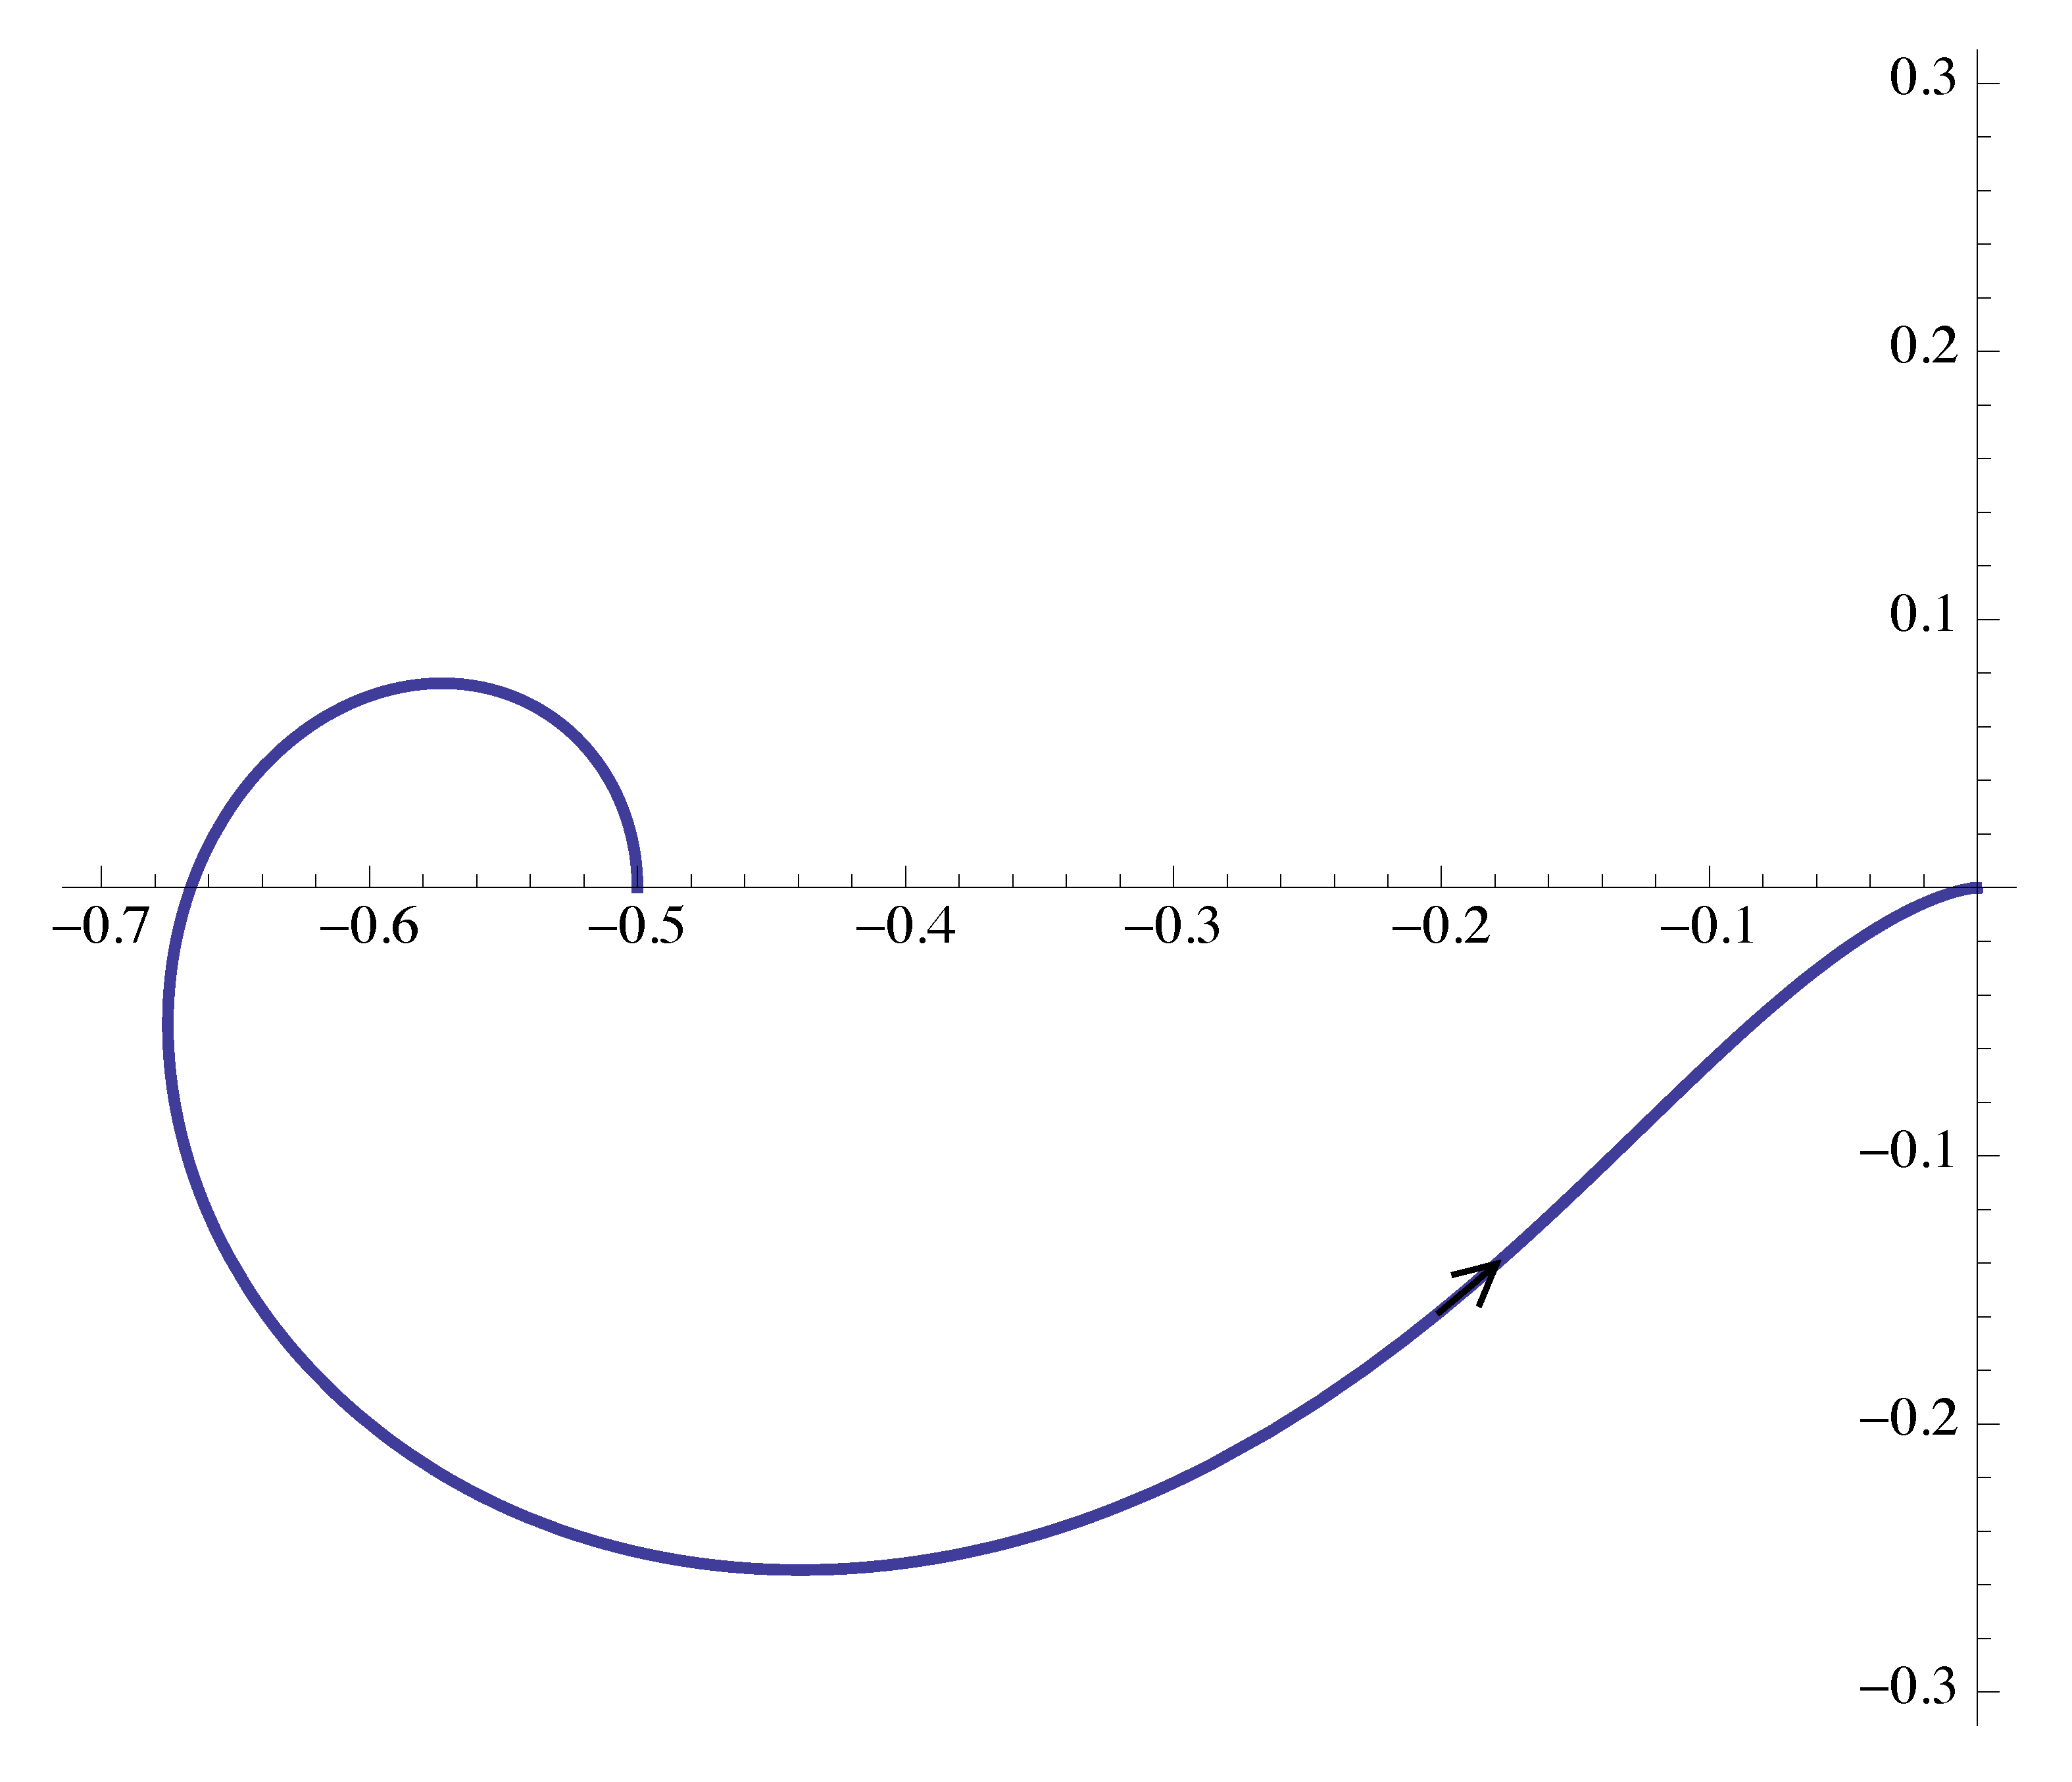
Figure 21: Nyquist plot of \(G(j\omega)\), part 2
- Use the reflection with respect to the real axis to complete the Nyquist plot for \(-\infty < \omega < +\infty\). Nyquist plot of \(G(j\omega)\) is shown in Figure 22.
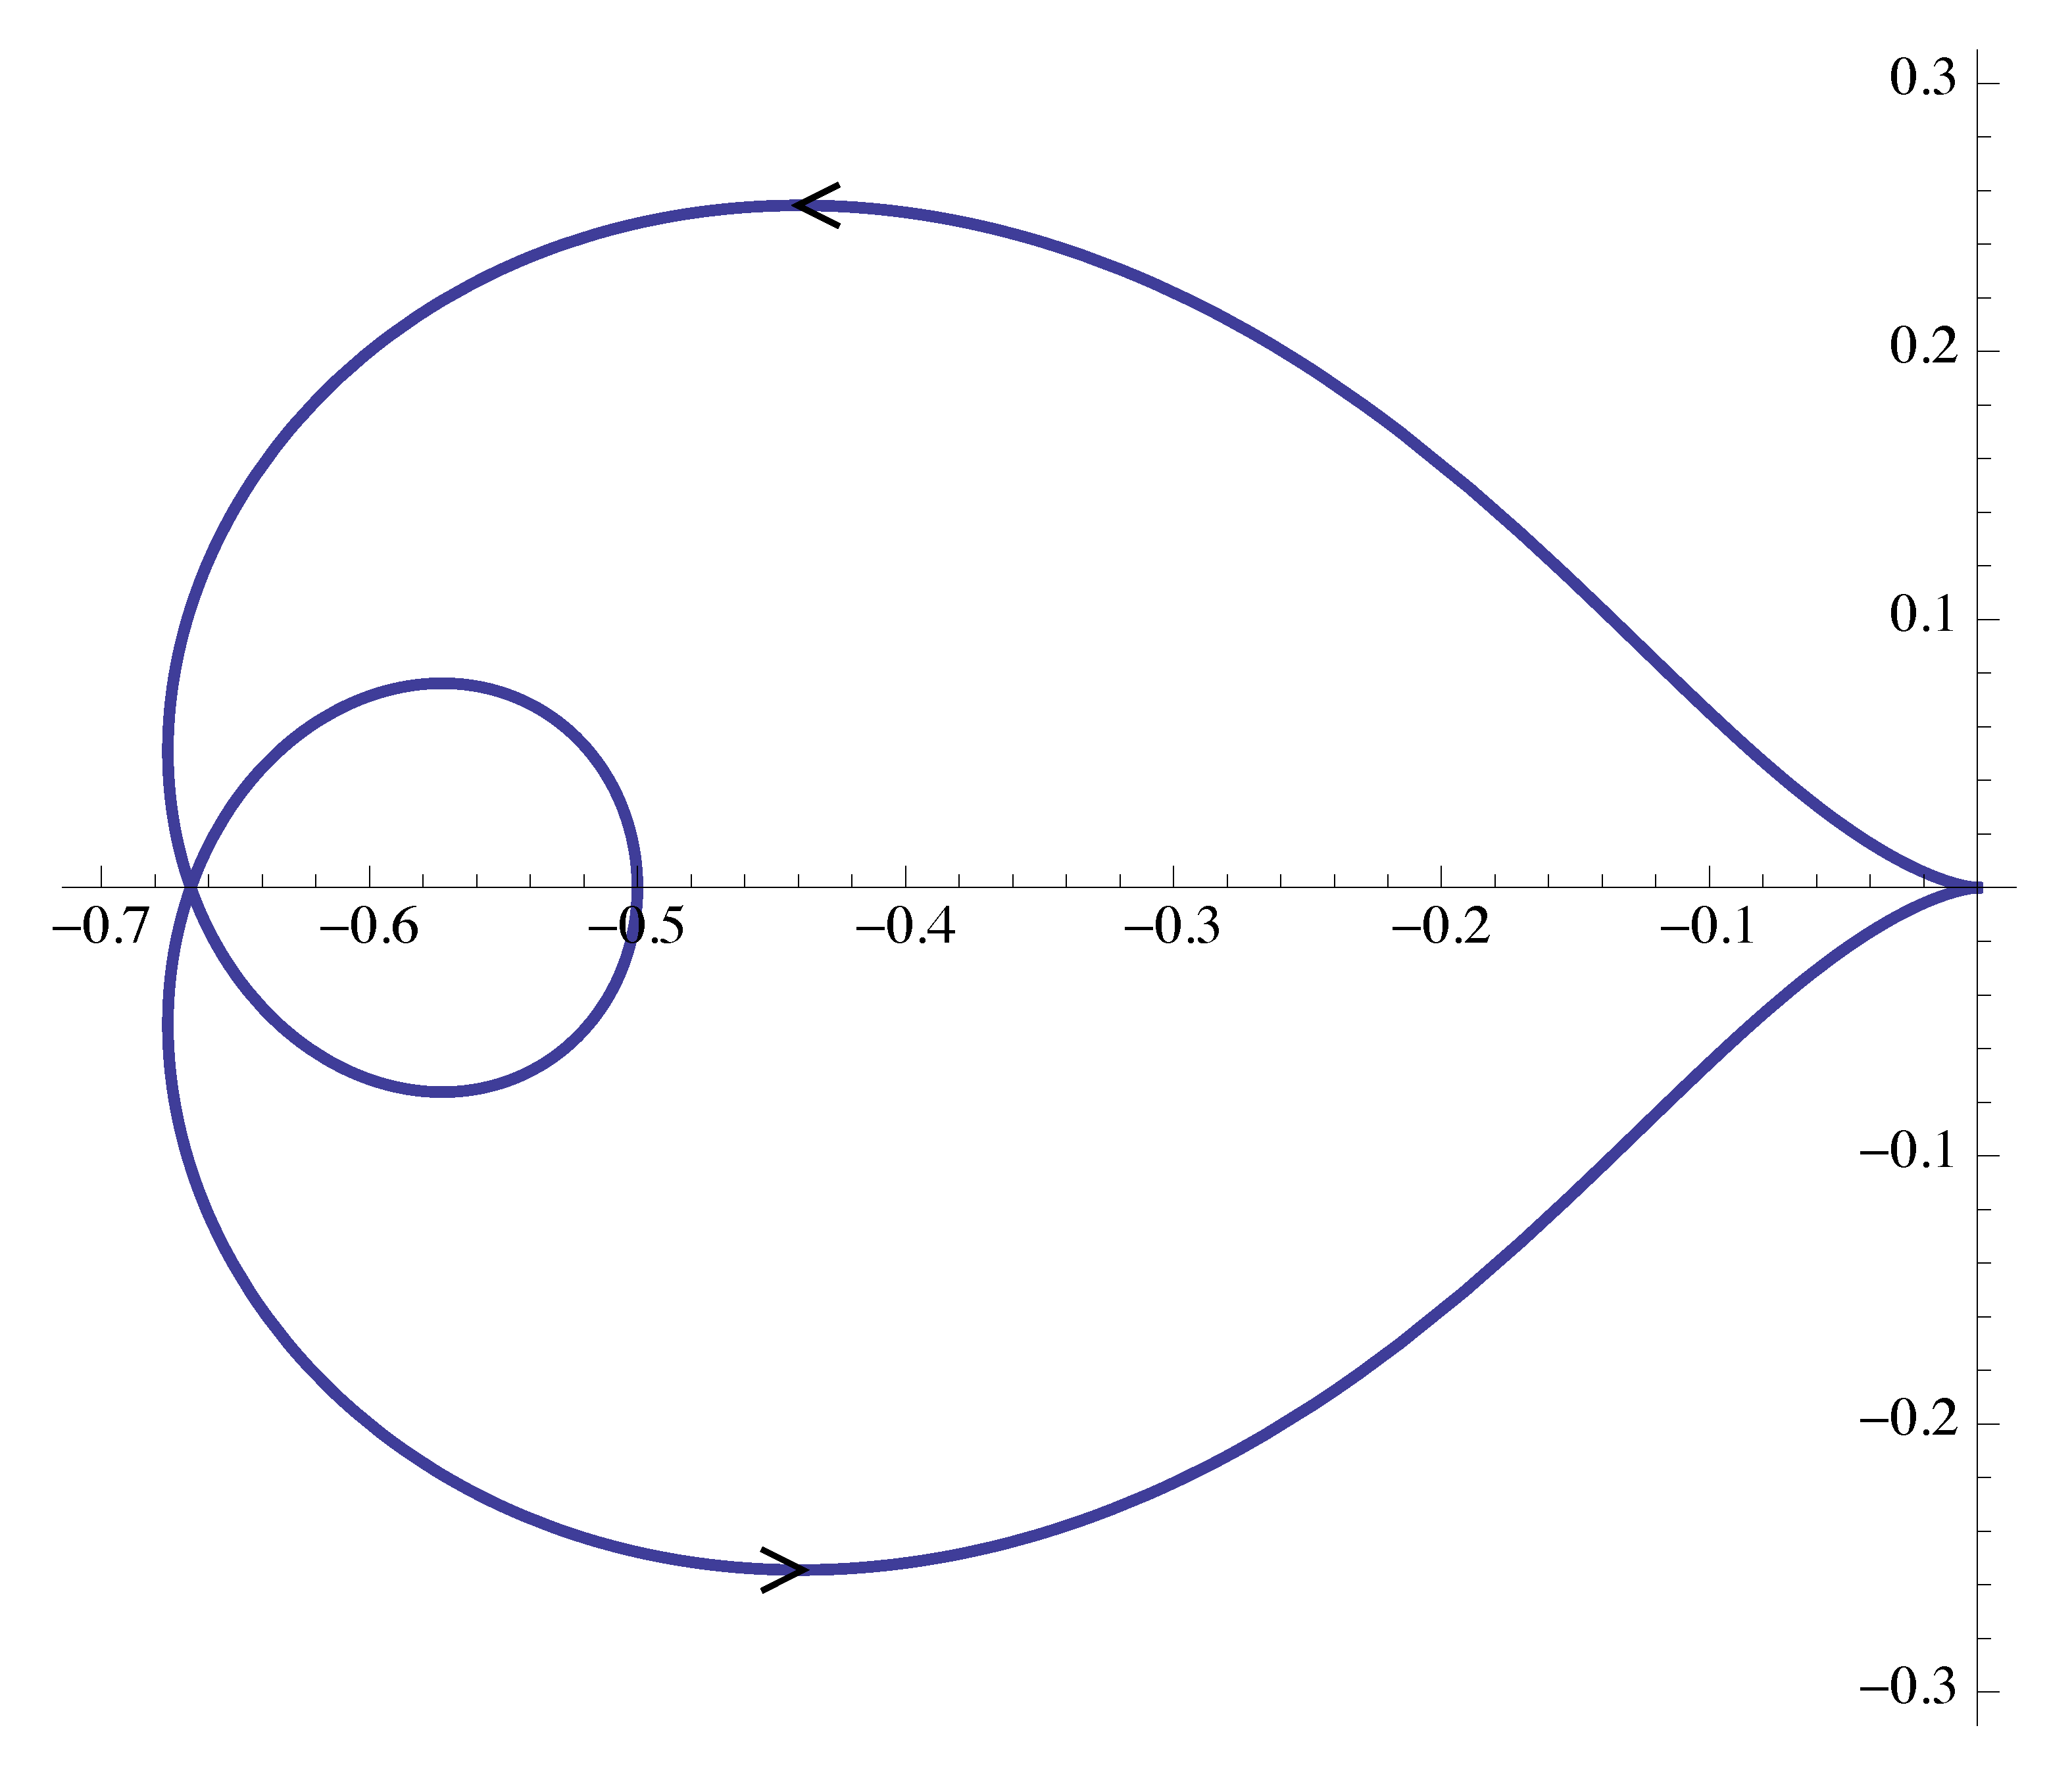
Figure 22: Nyquist plot of \(G(j\omega)\)
By Nyquist stability criterion,
\[ \#(\circlearrowright \text{ of $-1/K$}) = \#(\text{RHP CL poles}) - \underbrace{\#(\text{RHP OL poles})}_{=2}. \]
Therefore \(K \in \RR\) is stabilizing if and only if
\begin{align*} \#(\circlearrowright \text{ of $-1/K$}) = -2. \end{align*}Based on the Nyquist plot, three points on the real line divide the real axis into four segments. We want to calculate the encirclements of \(-\frac{1}K\) by \(G(j\omega)\) when \(-\frac{1}K\) falls into each of the segments.
The only way that the encirclements can be great than \(1\) is let
\[ -\frac{2}3 < -\frac{1}K < -\frac{1}2. \]
We obtain the range for closed stability \(\frac{3}2 < K < 2\).
Note we can interpret this range in terms of phase margin. Recall the phase plot of \(G(j\omega)\) in Figure 19.
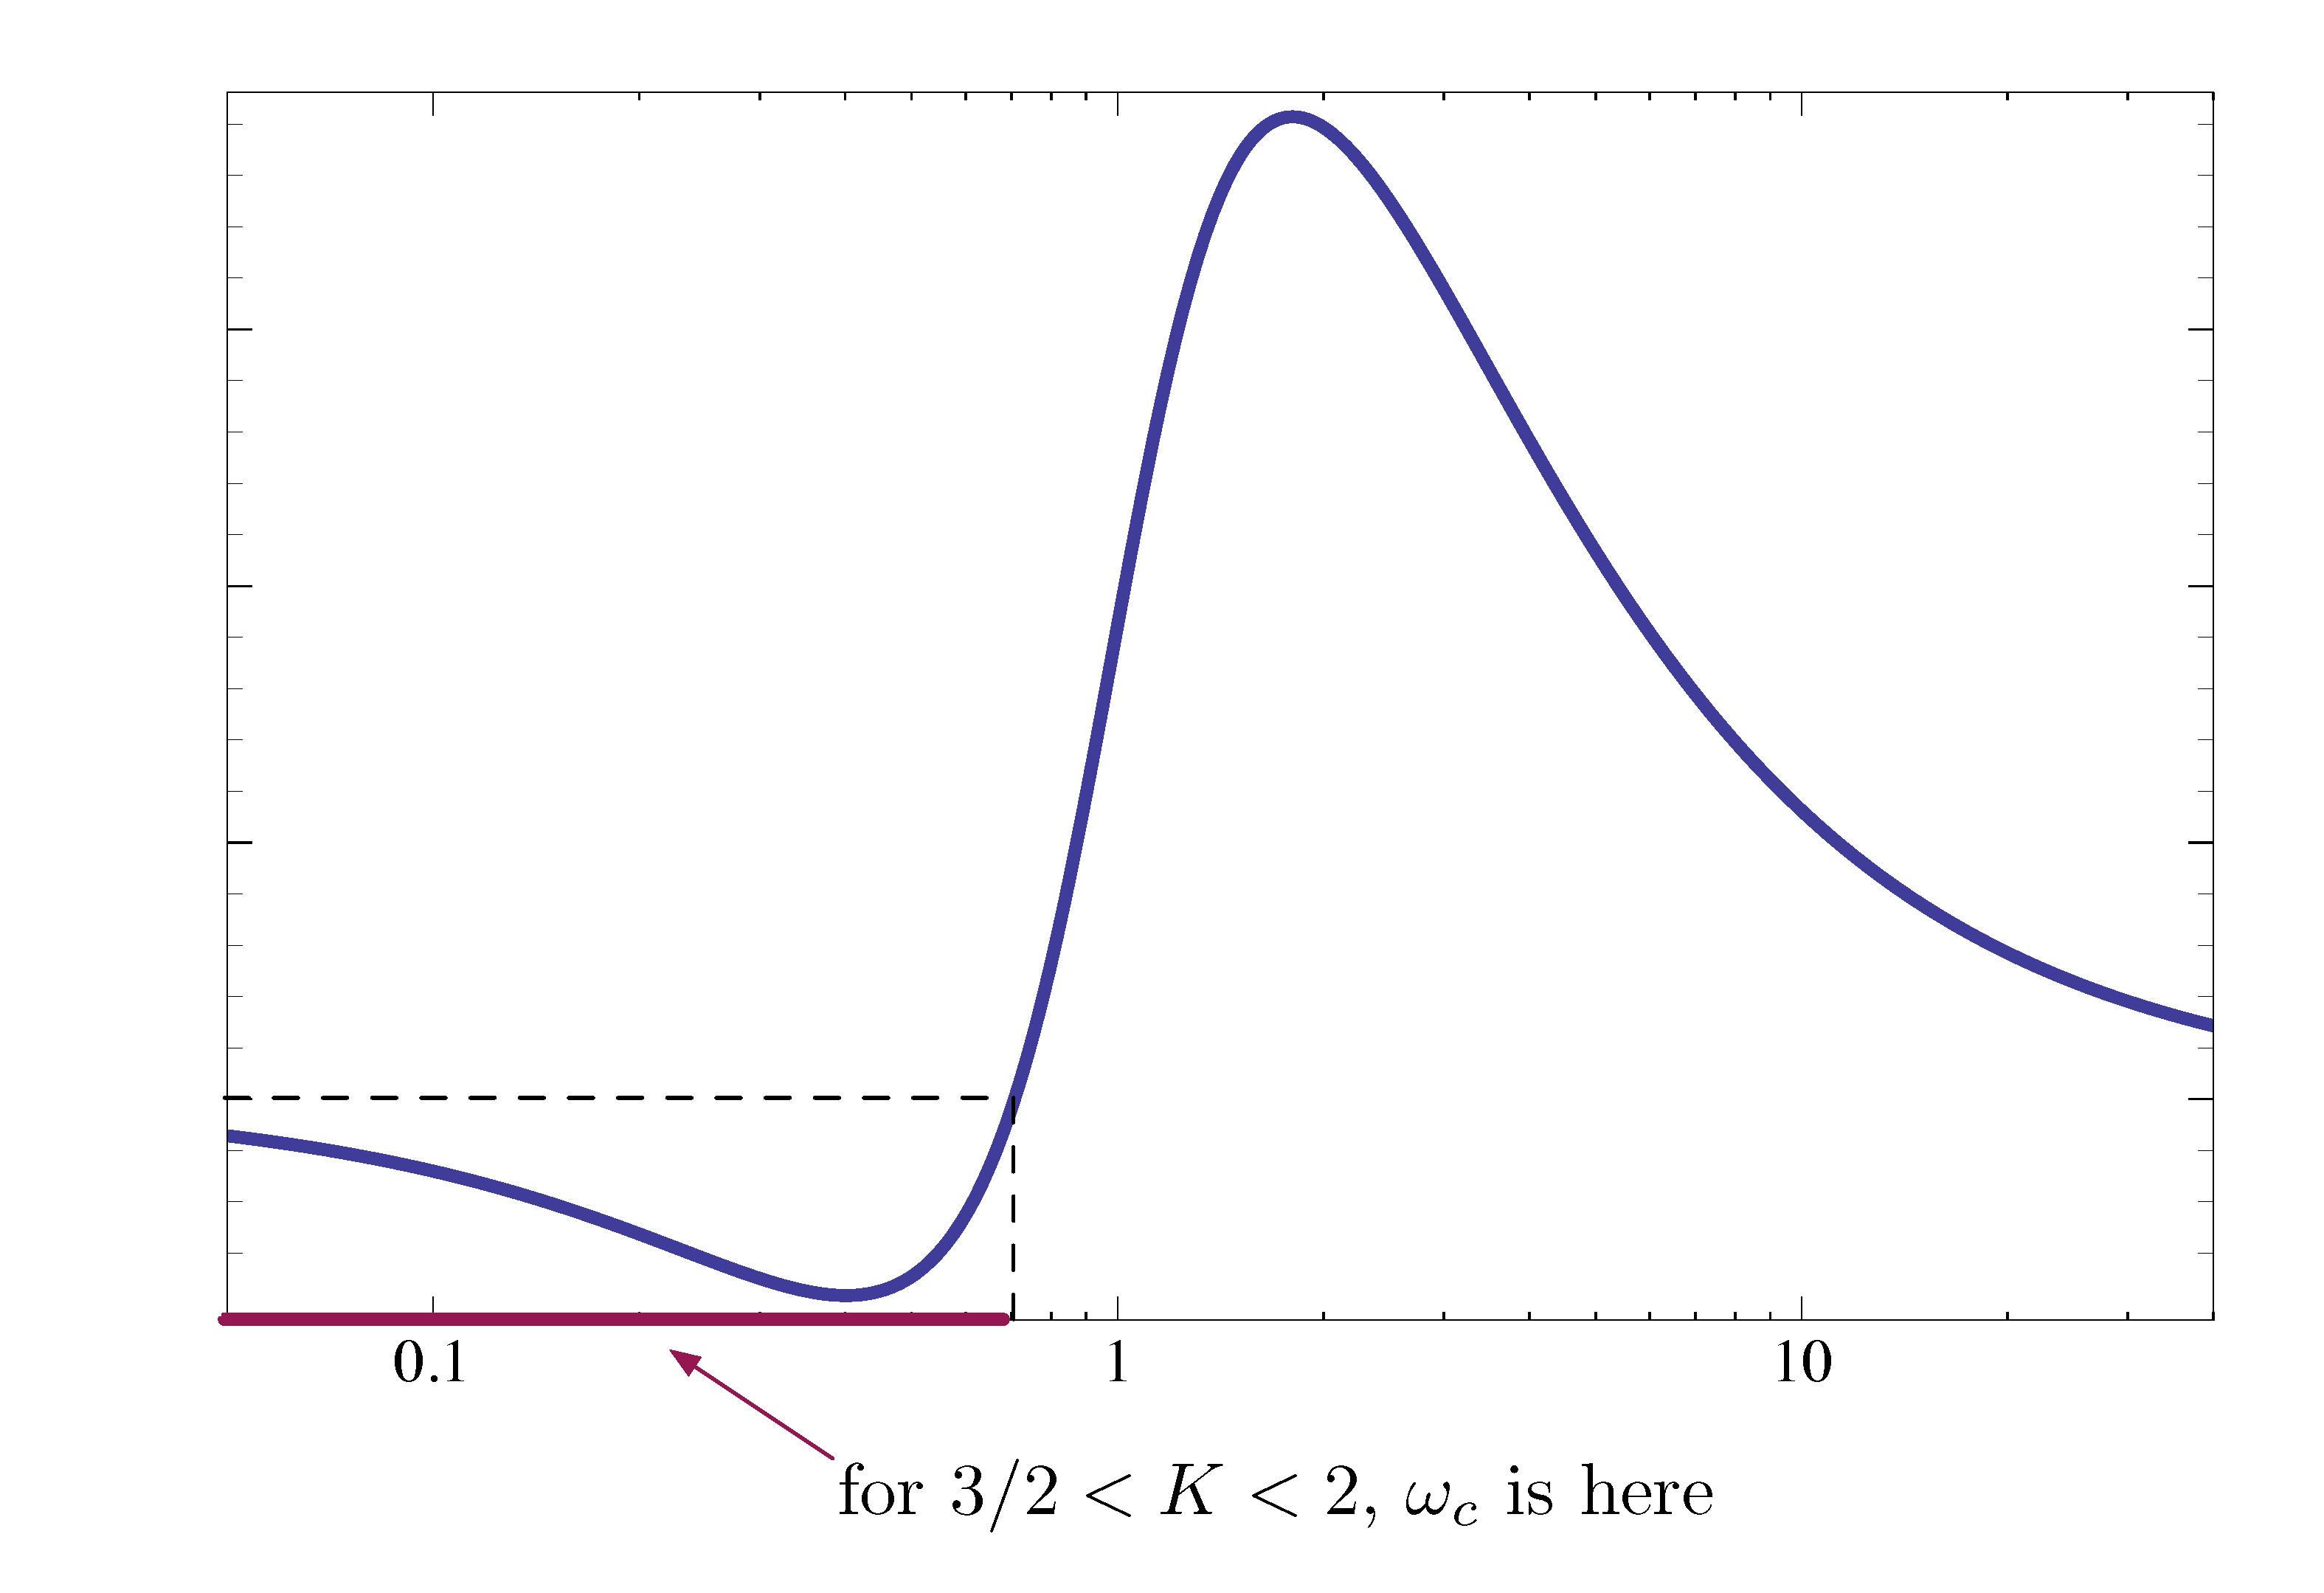
Figure 23: Phase plot of \(G(j\omega)\) and range of \(K\) derived from Nyquist criterion
In this case, we see stability \(\iff\) \({\rm PM} < 0\) (which is atypical). Nyquist criterion is the way to resolve this ambiguity of Bode plots.
Stability Margins
Now we can determine stability margins (gain margin and phase margin) from the Nyquist plot as well.
Consider Nyquist plot of \(KG(s)\) (we only draw the \(\omega > 0\) portion). GM and PM are defined relative to a given \(K\), so by Figure 24, overlaying a unit circle with its Nyquist plot,
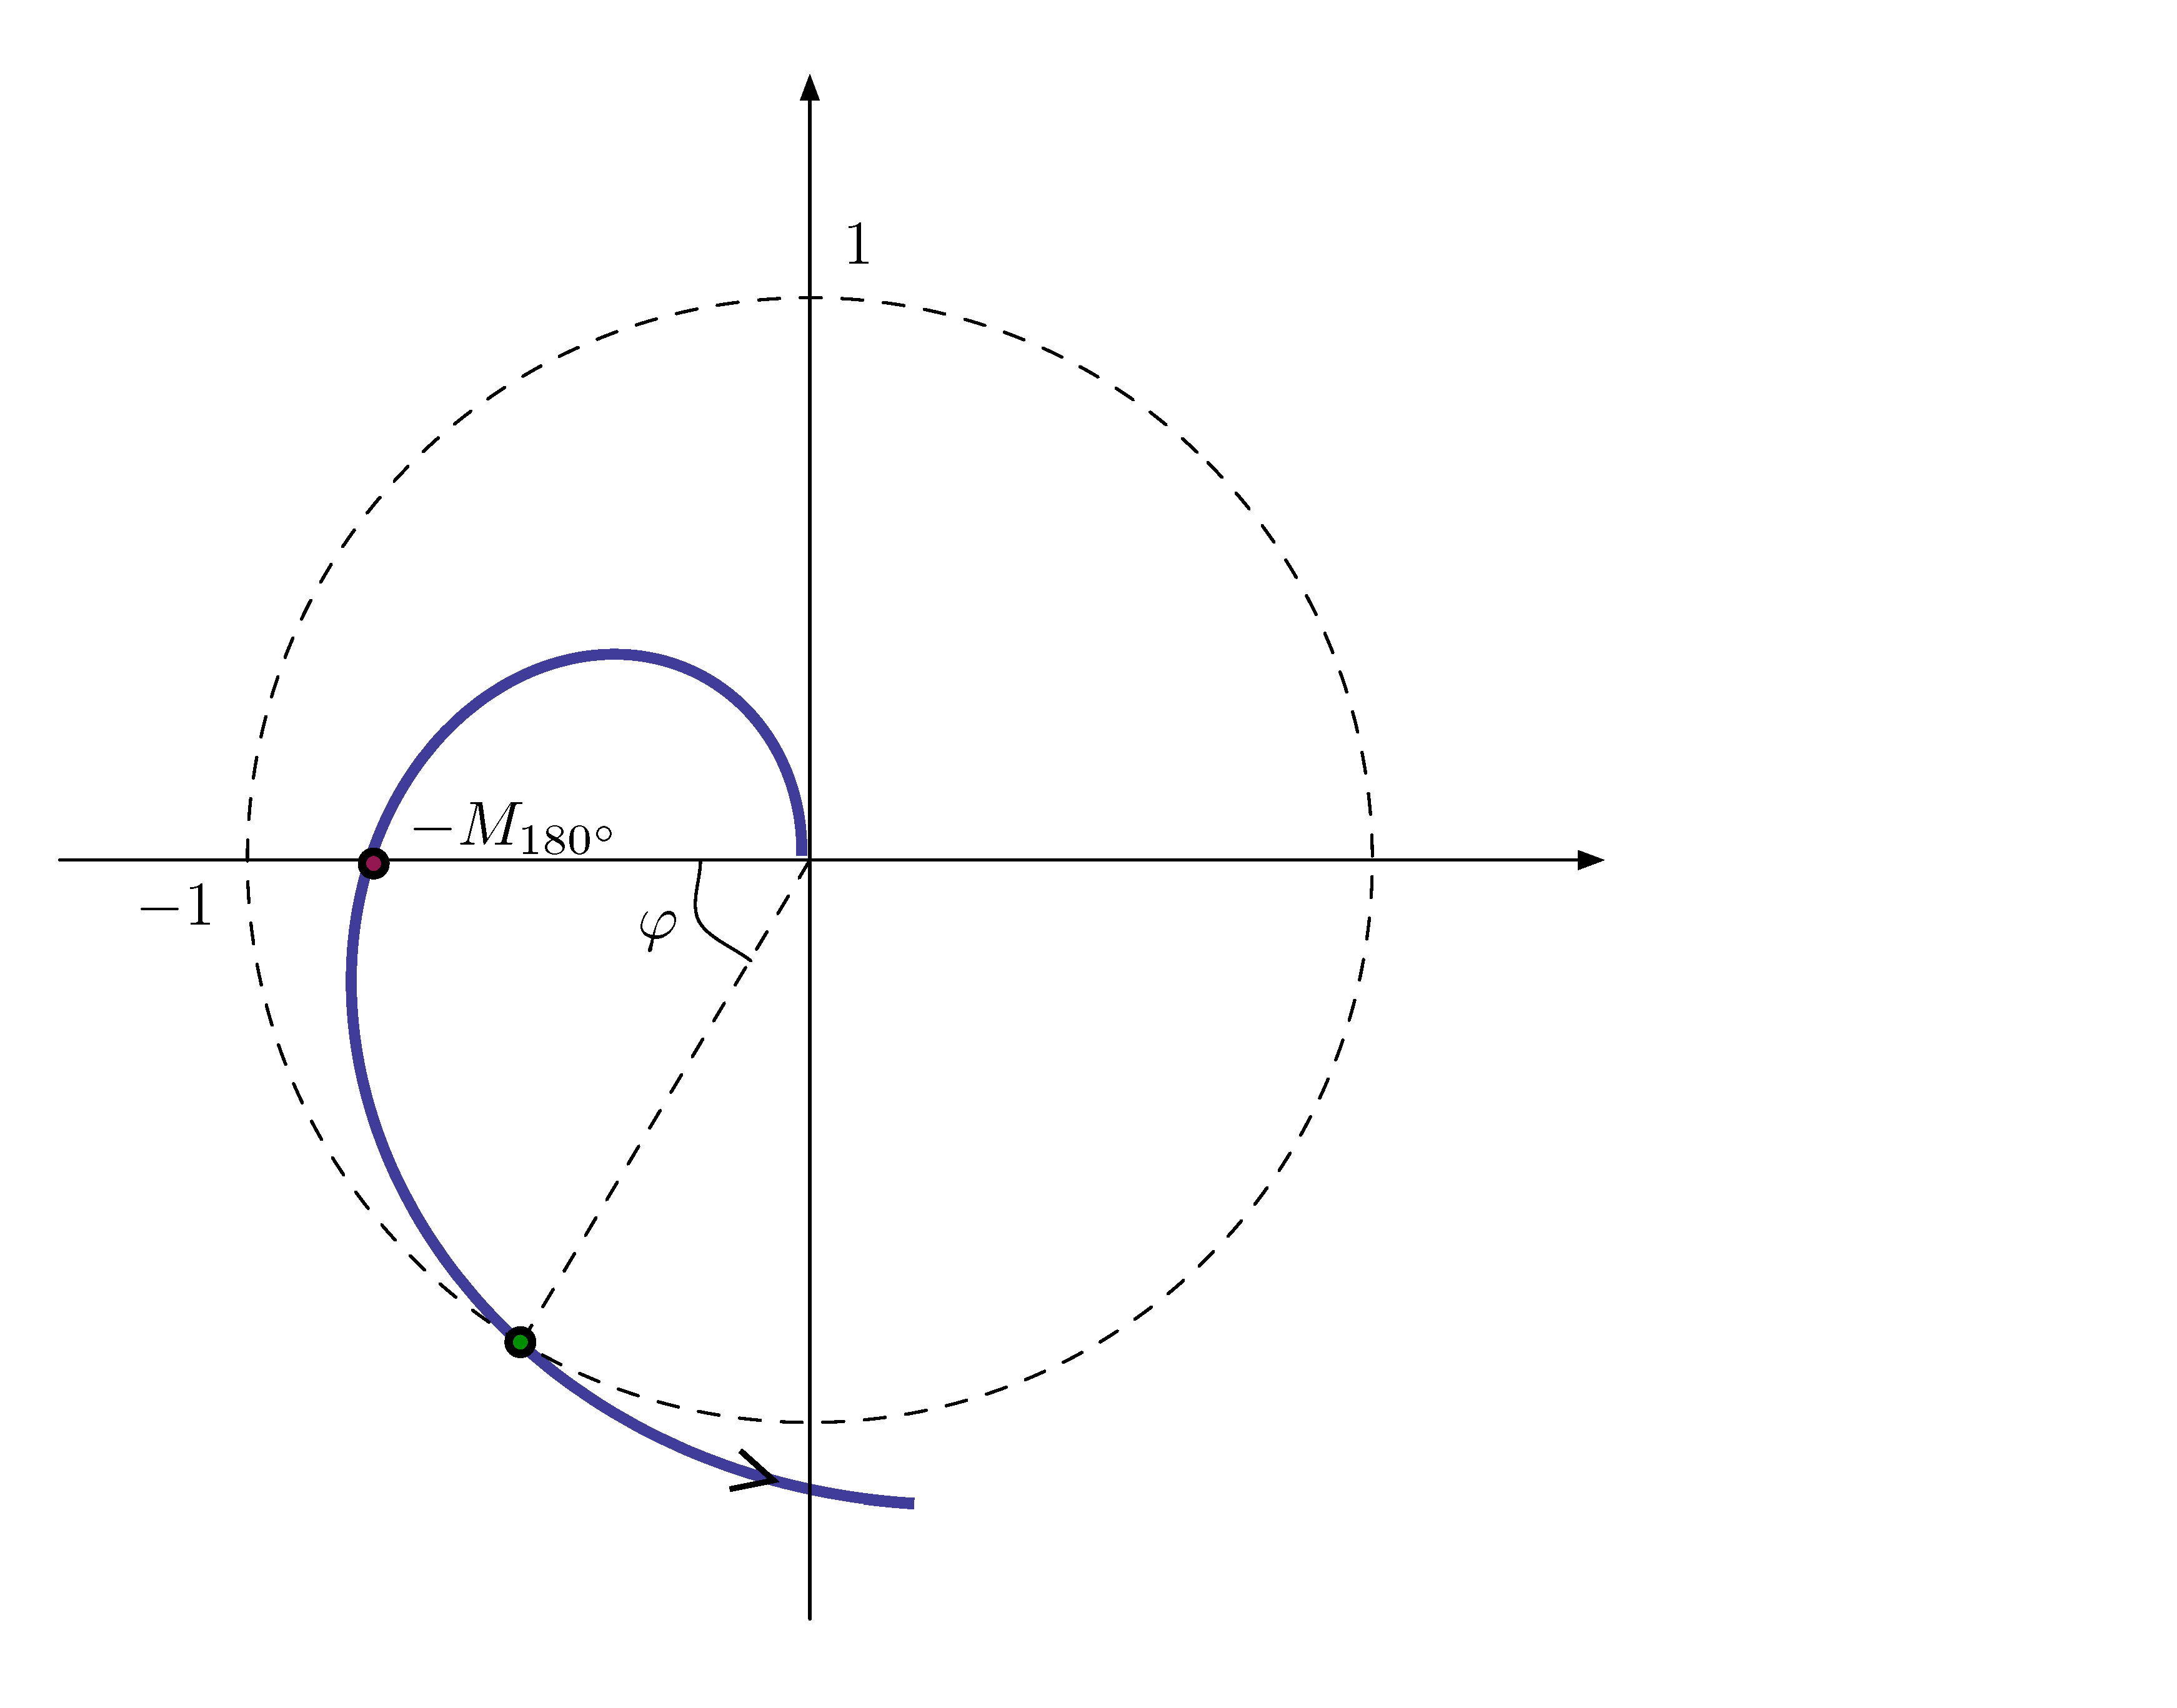
Figure 24: Stability margins derived from Nyquist plot
\({\rm GM} = 1/M_{180^\circ}\).
If we divide \(K\) by \(M_{180^\circ}\), then the Nyquist plot will pass through \((-1,0)\), giving \(M=1,\phi = 180^\circ\).
\({\rm PM} = \varphi\).
The phase difference from \(180^\circ\) when \(M=1\).