Layering Transitions and Dynamics in Confined Liquid Films
Rashmi Patil and Jordan Vincent
Results and Discussion
The
density profiles r(z)
for the confined film, recorded versus distance in the direction normal to the
surfaces, for a sequence of separations (gaps) D between the confining surfaces
is shown in Fig. 1. Here
the reduced bulk density r*
of the LJ fluid is 0.65 and efw=2eff. These profiles
show clear oscillatory patterns. For wide gaps a uniform bulk density
distribution develops in the middle of the confined film, with layering near
the two surfaces.
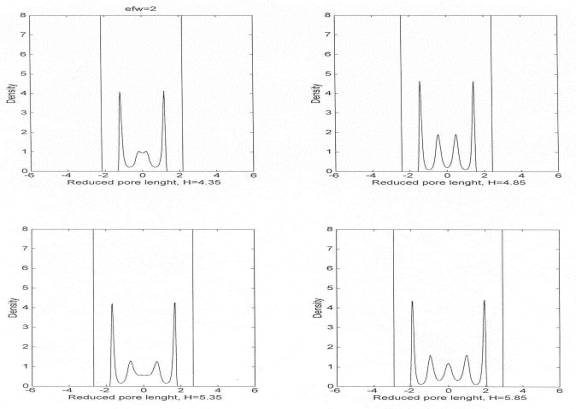
Fig. 1 Equilibrium density profiles for the
commensurate film along the z direction (normal to the confining solid
surfaces). The gap widths (H) for which the profiles were calculated are
indicated. Note that the liquid density outside the confinement is uniform and
remains constant for all values of H.
Solvation
forces f (H) recorded during the approach of the two surfaces are shown in Fig.
2. It is the total force exerted by the confined liquid on the confining
surfaces and this is the same as the force, which would be required in order to
hold the two surfaces at the corresponding separation. The layering transitions
in the confined films are portrayed in the solvation force oscillations (Fig. 2),
with local positive force maxima corresponding to configurations with well-formed
layers.
Fig. 2 Equilibrium solvation forces f in nN plotted
versus the width of the confining gap in A for r*=0.65 and r*=0.78. Dashed line: efw= eff; Solid line: efw=2eff; Dotted and dashed line: efw=4eff.
Fig. 3 shows a plot of solvation force vs. the distance between the plates with error bars. Though error bars were calculated for all cases they are not plotted to facilitate easy observation of trends. Irrespective of the distance between the plates, the error bars were nearly constant at about 1.4kT/e. It is suspected that it is largely due to systematic error but needs to be confirmed by running the code for longer times.
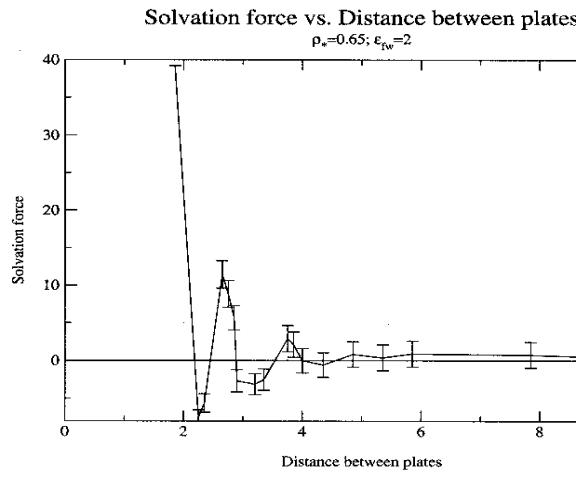
Fig. 3 Equilibrium solvation
forces f with error bars in units of kT/e plotted versus the width of
the confining gap in units of sigma for r*=0.65 and efw =eff.
Further
insight into the layering transition processes is obtained from Fig. 4 which records of the
number of atoms in the confined region N vs. the distance between the confining
surfaces (H). N varies in a step-like manner, with sharp drops in the number of
confined atoms occurring for the transition from n-layer film to an (n-1)-layer
one, with the steps becoming sharper as n decreases. This is because narrowing
the gap width results in expulsion of atoms from the confined region (squeezing
out of the film) and transition to a film with a smaller number of layers.
Fig. 4 Number of molecules in the confining gap n
plotted versus the reduced pore length for r*=0.65 and r*=0.78.
Plots of N/H versus H (see Fig. 5 where N/H is proportional to the number density of molecules in the gap) suggest that below a certain thickness (~6 layers) the films exhibit certain features characteristic of the solid-like response; that is, when the confining gap is slightly reduced, starting from one of the well formed layered configurations of the film with nL layers (corresponding to the maxima in the solvation force shown in Fig. 2), the film yields through the expulsion of approximately a layers worth of molecules into the surrounding liquid, causing a sharp decrease in the confined film density. During further reduction of the gap width, the number of confined molecules remains almost constant (plateaus of N, Fig. 4), with an associated increase of the confined film density (Fig. 5), which is accompanied by enhancement of the order in the film. This process continues till a gap corresponding to a maximally ordered layered film (with nL 1 layers) is reached, for which the confined film density maximizes. This sequence of events is repeated with a period of ~0.35 nm.
Fig. 5 Number of molecules in the confining gap Nper
unit gap width H plotted versus the gap width H in A for r*=0.65. The meaning of the lines remains the
same as in fig. 2.
Fig. 6 shows ln(z1,max/z 1,min), ln(z2,max/z
2,min) and ln(z3,max/z3,min)as a function of
pore length for r*=0.65.
The various z's have been defined in Fig. 1. ln(z1,max/z 1,min)
gives a measure of the barrier a particle has to overcome in order from one
layer to the adjacent one. These profiles show clear oscillatory patterns. The
local maxima correspond to configurations with well-formed layers.
Fig. 6 Plot of ln(z 1,max/z 1,min), ln(z 2,max/z 2,min)
and ln(z 3,max/z 3,min)
as a function of pore length for r*=0.65. The meaning of the
lines remains the same as in fig. 2.
Fig. 7 shows the plot of the pair-distribution (PDF).
Concentrating on the first two peaks of the PDF, we note that two smooth peaks
exist at high pore widths. As the degree of confinement is increased, the first
peak becomes more pronounced in magnitude and narrower in width and the first
minimum decreases in magnitude.
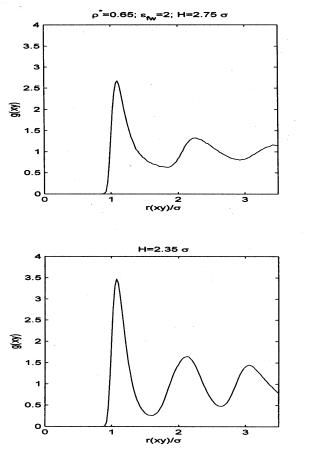
Fig. 7 plot of the pair-distribution
(PDF) for reduced pore lengths 2.75s and 2.35s.
These
results suggest that the confined spherical LJ liquid exhibits certain features
of characteristic of solid-like response; that is, when the confining gap width
is slightly reduced, starting from one of the well-formed layered
configurations of the film with n layers, the film yields through expulsion of
approximately a layer worth of atoms into the surrounding liquid, causing a
sharp decrease in the confined film density. Further reduction of the gap
width, the number of confined atoms remains almost constant that is accompanied
by the enhancement of the order in the layered structure of the film. This
process continues until a gap width corresponding to a maximally ordered layered
film (with n 1 layers) is reached, for which the confined film density
maximizes.
The
density profiles r(z) for the confined film, recorded versus distance in the direction
normal to the surfaces, for a sequence of separations (gaps) D between the
confining surfaces is shown in Fig. 1. Here the reduced bulk density of the LJ
fluid is 0.65. These profiles show clear oscillatory patterns. For wide gaps a
uniform bulk density distribution develops in the middle of the confined film,
with layering near the two surfaces.