
Simulation Results We present the following sample simulation results:
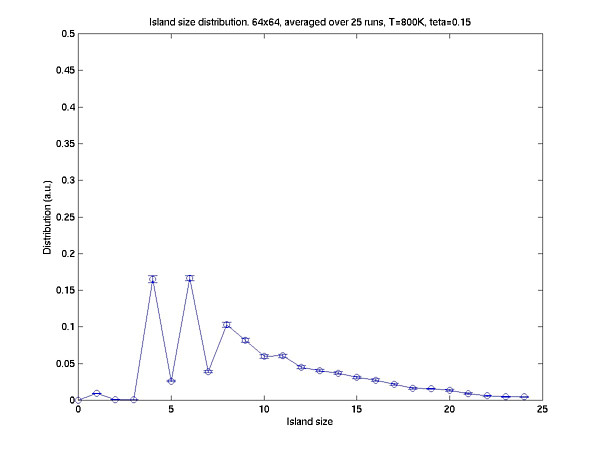
Simulation of island size distribution
Simulation of oscillations in step density
The first 3 plots shows, the resulting island size distributions at 600, 800 and 1000K. The distribution with 600K looks very much like the expected distribution. However, at 800K we see that for small odd numbers the island sizes are less favorable than the even ones. This, we attribute to the fact that islands with even number of atoms are more stable, and at this temperature, the islands with odd number of atoms loose their extra atom. However, at 600K the extra atom does not have energy to leave, so we do not see this effect. At 1000K, we see that the distribution extends over much larger island sizes. Since the resulting number of islands are smaller, the error bars are much larger for this case.
Except from the effect on error bars at large T, the lattice size was checked not to have influence on the distributions, by repeating the runs for 128x128 lattice and also for 256x256 lattice at 800K.
For these simulations we used a value of 1.3 eV for the surface energy barrier and 0.5 eV for the bond energy.

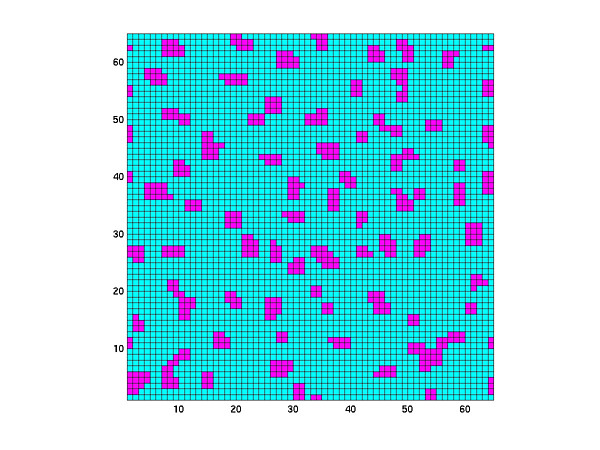
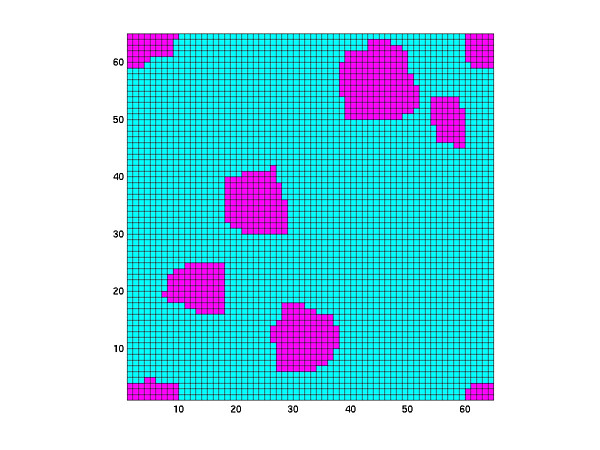
The next three plots shows snapshots of the surface morphology at 600, 800 and 1000K respectively.

Oscillations in RHEED intensity patterns are one of the most useful techniques for the MBE crystal grower. The RHEED intensity is a function of the surface roughness. The oscillations in intensity during growth correlate with monolayer completions. During growth as each monolayer is completed, the surface roughness decreases, yielding an increase in RHEED intensity.
The simulations of the step density with KMC lends insight into the process. These simulations also are a good test for the simulator itself as, they require, simulation of deposition of at least several layers of atoms. So, long simulation times are required.
We present the results for our simulations below. We must emphasize that these are outputs from individual runs; thus error bars on the plots are not available. The reason we present them here is to demonstrate that the code is capable of handling these long simulations, reproducing the qualitative behavior.
The following simulations were run without using an Erhlich barrier. The simulation domain was 64x64. The impingement rate was 4e18 atoms per meter squared, per second, corresponding to about 1 microns per hour. Clearly, at low and high temperatures, oscillations are either not observed or weak, whereas an "optimized" growth temperature gives strong oscillations.

The inclusion of an Erhlich barrier in the simulation, makes it difficult for the atoms to fall down the edges. The net result is a significant increase in surface roughness. The following graph presents a qualitative comparison of two cases, one with and the other without Erhlich barrier. The simulations were done at 700K. The simulation without the Erhlich barrier is identical to the one presented in the above graph for 700K. The Erhlich barrier was taken as 0.3 eV.
