Here are examples of an input file and initial lattice.
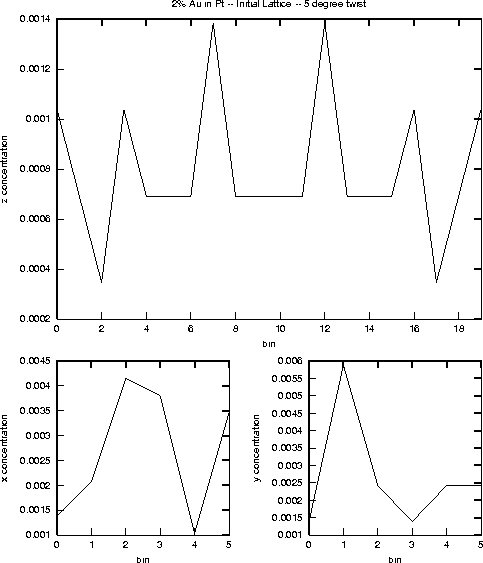
The above initial lattice has a twist angle of 5 degrees and its concentration profile is shown below.

The following images show the final concentration of the Au atoms for temperatures of 10K,100K,300K, and 800K after performing 400000 MC steps. Click on each graph to see a time evolution of the concentration in (100000 steps/frame).
It is clear from these final concentrations that for T <= 300K the Au atoms do segregate. However, the do not migrate to the grain boundary (at bins 0,9, and 19). Instead, they segregate toward certain areas of the x-y faces of the simulation box. Due to the periodic boundary conditions applied in the twisted lattice, a few rows of vacancies are created. Thus the Au atoms are migrating to these vacancies instead of the grain boundary.
For T=800K a slightly different behavior is seen in the z-concentration. In this case the peak structure found is closer to being constant as opposed to the sharply peaked results for the lower temperatures. This is due to the larger fluctuations in energy allowed at the higher temperature.
The following is a table of the acceptance ratios and total potential energy for the T=800K run. The other temperatures simulated displayed similar behavior. It is not clear that the potential energy has reached its minimum value, but this is partly due to the large number of steps per sample. A finer grained sample would likely give a better estimate as would running more MC steps.
| steps | A moves | B moves | A,B swaps | Potential |
| 100000 | .742 | .223 | .0212 | -4.20 |
| 200000 | .738 | .290 | .0098 | 1.18 |
| 300000 | .735 | .309 | .0134 | -4.81 |
| 400000 | .733 | .299 | .0123 | -6.00 |