

In accordance with the simulation procedure described above, a series of
experiments was run
using 20 by 34 array of hexagons containing a total
of 2760 cross-links (the particles) and 4027 agglomerations
(the springs/ellipses).
Extensional deformations imposed from zero
through ten non-dimensional units were applied in unit increments to both
top and bottom domain boundaries which were then held in place at their
new positions.
The following graphs show the initial configuration for the
largest (20 unit) extension and its equilibrated configuration.


Monte Carlo runs were undertaken for each extension, and orientation distributions, average asphericities, and average widths were computed.
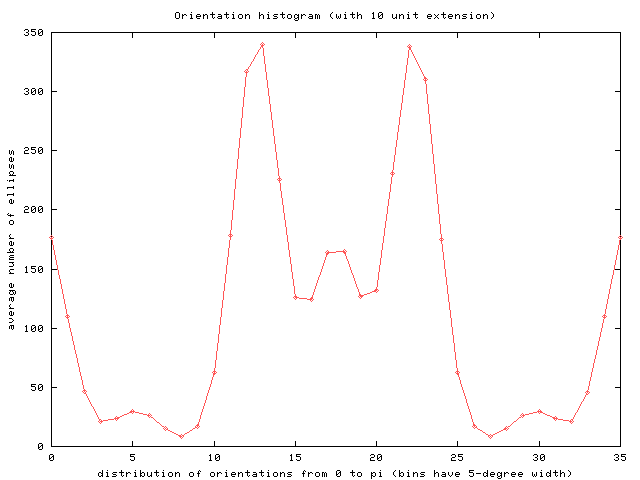
The histogram plots of orientation were binned only over equilibrated sweeps.
For increasing extension, these plots show a greater tendency for the
agglomeration to align with the direction of stretch
![]() .
Note that the six peaks present in each graph correspond to the
three unique directions occuring as the sides of the hexagons
and their perpendiculars.
.
Note that the six peaks present in each graph correspond to the
three unique directions occuring as the sides of the hexagons
and their perpendiculars.


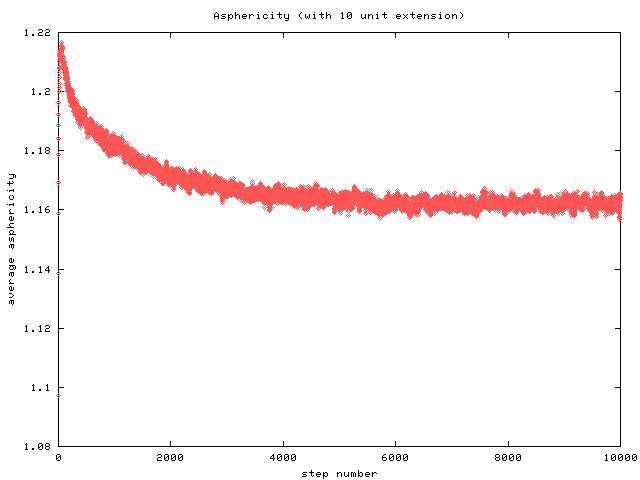
For non-trivial extensions, the plots of average asphericity show an early
peak before settling down. This is because the springs attached to the
cross-links on the upper and lower boundaries are initially severely
strained as a result of the imposed deformation there.
At this point, the
rest of the network hasn't yet responded to relieve the stretch in those
springs. So, correpsonding to this delay is a peak in the
asphericity-entirely due to the stretched, boundary springs.

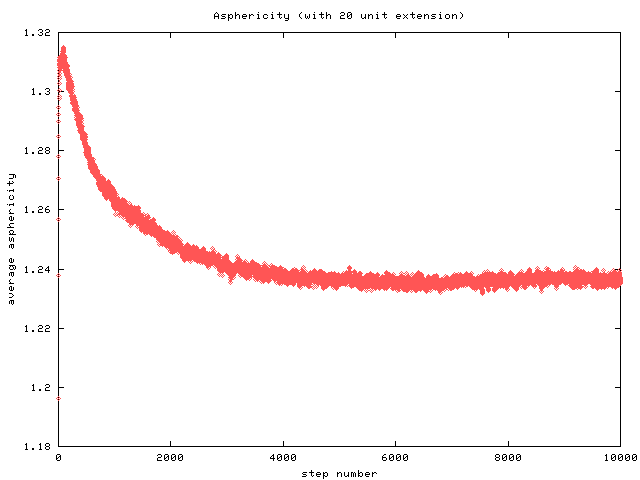
After some
simulation time has elapsed, the rest of the network reconfigures itself
to relieve the initial spike in the asphericity. However, for greater
extensions, at equilibrium, the asphericity is seen to increase above the
isotropic value of ![]() . This trend makes sense since the imposed
deformations cause the entropic springs to stretch and make it impossible
for the agglomeration to remain circular.
. This trend makes sense since the imposed
deformations cause the entropic springs to stretch and make it impossible
for the agglomeration to remain circular.
While the distribution of orientation and average asphericity show
expected trends,
the results of computed average widths for various
extensions are less encouraging. For our greatest, imposed
elongation, there is actually a slight expansion in the lateral direction,
contrary to physical reality for rubber networks.
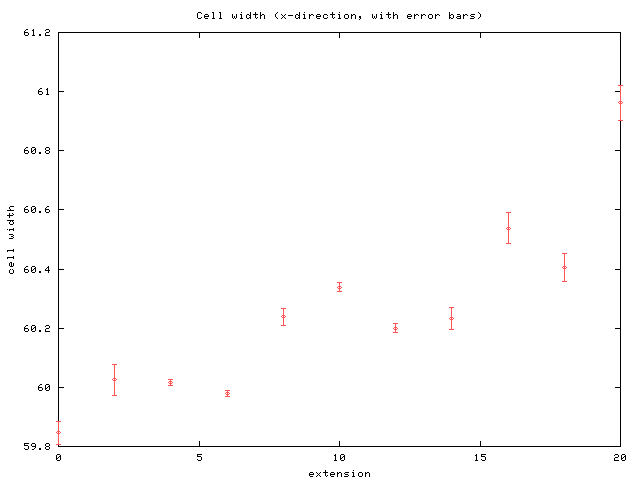
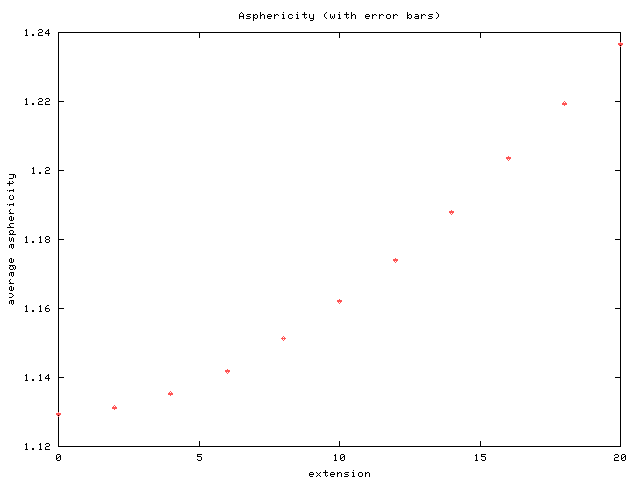
The following table lists the error in the mean for the
average asphericity computed for
![]() unit extensions.
Notice that the variance is so small that the error bars are
not resolved on the accompanying plot.
unit extensions.
Notice that the variance is so small that the error bars are
not resolved on the accompanying plot.
| mean | variance | correlation time | # effective points | error in mean |
| 1.12934 |
|
10.9708 | 182.302 | 0.000116019 |
| 1.13119 |
|
9.95896 | 200.824 | 0.000108366 |
| 1.13529 |
|
8.86313 | 225.654 | 9.77175e-05 |
| 1.14186 |
|
9.90055 | 202.009 | 0.000101278 |
| 1.1513 |
|
12.7529 | 156.827 | 0.000125864 |
| 1.16207 |
|
11.2436 | 177.879 | 0.00010901 |
| 1.17405 |
|
16.2805 | 122.847 | 0.000130889 |
| 1.18792 |
|
14.8714 | 134.486 | 0.000118683 |
| 1.20353 |
|
10.6 | 188.679 | 9.35175e-05 |
| 1.21929 |
|
10.5706 | 189.204 | 9.20694e-05 |
| 1.2366 |
|
8.55696 | 233.728 | 7.4813e-05 |
The source code used for the simulations is available.