For each set of parameters (Nc, P), the growth radii Rg, Rmax, and the fractal dimension d are measured. We run the program 10 times (with different random number seeds) to obtain the error bars. Each run takes 2000 time steps.
We grow the bacterial colonies in different conditions:
1. One inoculation points at the center (100,100)
(a) Fixed surface roughness Nc=6
Vary
initial nutrient concentration P= 9.0, 7.0, 5.0, 3.0, and 1.0.


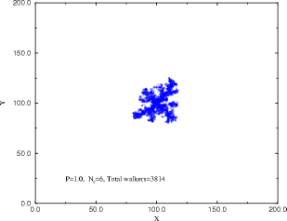
Obviously, as the nutrient
concentration decrease from 9.0 to 1.0, not only does the growth radius
decrease sharply, but also the structure changes from highly compact to
ramified and branching. Also, the number of walkers in the final stage
(after 2000 steps) decreases from 105 to 103.This
is typical behavior for a diffusion-limited process, as has been observed
in many living and non-living systems. The bacteria interact locally through
nutrient consumption and in starvation conditions tend to branch to reach
the optimal amount of food.We shall
see in the following dimensional analysis how the fractal dimension depends
on the availability of the nutrient.
(b) Fixed initial nutrient concentration P=2.0
Varying
surface roughness Nc=2, 4, 6, 8 and10


As expected, the growth
radius decreases with increasing surface roughness, since more efforts
are need to push the envelope and lubricate unoccupied space. However,
the fractal dimension does not seem to change too much with the roughness,
as seen from the similarity between the four patterns generated from different
Nc. Also, the total number of walkers in the final stage is
almost in the same order, in contrast to the sharp change when the nutrient
concentration is varied with fixed surface roughness. Since the initial
nutrient level is fixed at P=2.0, which is not high, we don?t see compact
(dimension=2) patterns even on very smooth surfaces.
2. Two innoculation points at different locations
(a)Nc=6, p=5.0;
Inoculation
points (40,100) and (160,100), Dd=80

At large distance, Dd=80,
the two colonies grow almost independently and the generated patterns are
just like individual ones.
(b)Nc=6, p=5.0;

When
the two colonies are brought to close enough to each other, they begin
to compete with for the food. The
pattern above shows that a wide gap exists between the patterns generated
by two colonies. Instead of
running into their cousins, they tend to grow in the opposite direction
and keep a distance from their competitors.It
is interesting to make the analogy between the interactions of two bacterial
colonies and the coulomb interaction between two disk capacitors with like
charges. When the two capacitors
are far enough apart, the charges are just evenly distributed on the disk
surface. With decreasing distance,
the charges on the two disks repel each other and tend to flow into the
opposite side. Here the two
bacterial colonies behave just like there is an expelling force between
them. However, the interaction
is not from a simple force, but is indirectly associated with the competition
for food.
Growth radius Rg,Rmax:
We measure the growth radius
Rg (defined as squared averaged radius ![]() )
and Rmax for each set of parameters.
)
and Rmax for each set of parameters.
(1)Fixed roughness Nc=6

(2)Fixed initial nutrient concentration.

The tendency of the change
of growth radius is as expected and the error of the estimated average
of each data set are reasonably small, which confirms the robustness of
the growth algorithm in our program. The maximum radius is almost twice
the gyration radius Rg, while for evenly distributed round disk,
the expected ratio is ![]() .
The difference in the ratio is not simply caused by the fact that the fractal
dimension of the bacterial colonies is less than 2, but also by the high
concentration of walkers in the center due to the initial innoculation.
If instead, we release the initial walkers from the edge and let them move
randomly until sticking to some fictitious attracting center, the ratio
of Rmax over Rg might represent the fractal effect
more realistically.
.
The difference in the ratio is not simply caused by the fact that the fractal
dimension of the bacterial colonies is less than 2, but also by the high
concentration of walkers in the center due to the initial innoculation.
If instead, we release the initial walkers from the edge and let them move
randomly until sticking to some fictitious attracting center, the ratio
of Rmax over Rg might represent the fractal effect
more realistically.
Fractal dimension:
Due to the high concentration in the innoculation
center and the compactness of the growth radius at low concentration or
high roughness, the measurement of the fractal dimension is less smooth
than those of the radius.
(1)Fixed roughness Nc=6

(2)Fixed initial nutrient concentration P=2.0

Both curves show that the fractal dimension is not strongly dependent on the surface roughness, which does not agree with the experimental observations that the patterns become more ramified at harder agar surface. One possible reason is that in our simulation, the surface hardness is not high enough to see substantial changes in the dimension. The 2000 steps take about 8 minutes on a workstation, and if we can make our codes run faster, it is possible to grow the same size of bacterial colonies on extreme hard surfaces and analyze the dimensional dependence on Nc.