Rupture experiments have become common in biology laboratories in the determination of molecular bond strengths and the analysis of phenomena mediating cell adhesion in living organisms. While computer simulations and experiments have been performed on specific systems with custom potentials and atomic force microscopy set-ups respectively, we have used a simple and general model to analyze the detachment of molecules with langevin dynamics based on the Lennard-Jones potential and a harmonic spring constant. The introduction of a random noise in the simulation was neccessary in order to imitate the effects of brownian motion due to the interaction of the local environment with the biological system.
Background
Cell adhesion is a dynamic process, mediated by specific interactions between receptors and ligands in a medium. The reaction kinetics of the specific interactions are therefore very important for the kinetics and mechanics of the cell adhesion process. In various single molecule pulling experiments, the loading rate's dependence on the rupture force is measured. It therefore becomes possible to determine the lifetime of a bond subjected to an external tensile force.
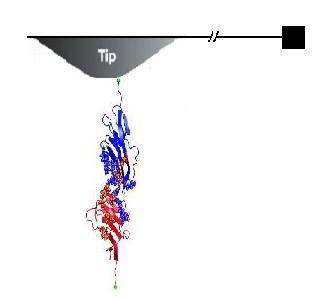
In experiments, an anchored molecule or molecular assembly is attached to a pulling spring or an AFM tip as in Figure 1 above. This spring is then moved away from the anchored molecule at a constant pulling velocity v and the dynamics of the molcule is analyzed to understand the nature of the bond. Bell (1978) gave a phenomenological formalism in describing a system being pulled over a barrier by the application of a time-dependent force F(t), with its free energy surface having just a single well. The probability S(t), that rupture has not yet occured at time t was given by S' (t) = -k(t) S(t) where k(t) is the time-dependent rate coeffcient given by k(t)= ko exp [F(t)x*/ (kT)]
with x* being the distance from the free-energy minimum to a barrier. This description does not however take into account the fact that the molecular coordinate fluctuates under the influence of the combined molecular and pulling potentials. Hummer and Szabo (2003) however gave a detailed analysis with a simple microscopic model of the kinetics of rupture and proposed a new procedure for analyzing experimental data leading to more accurate estimates of ko, the intrinsic rate constant. The molecular free energy surface was given with respect to a molecular spring constant km. The results were calculated for high and low loading rates to be
respectively. Where  and f is the average rupture force at the pulling velocity, v with x being the rupture distance. Figure 2 shows their comparative results for the average force at unfolding as a funcion of pulling velocity.
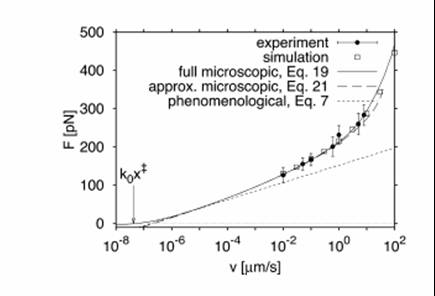
Fig 2
Steered molecular dynamics (SMD) simulations have been used in numerous studies to understand the mechanisms behind force-induced bond failure. Bayas et al have performed SMD on forced detachment of CD2-CD58 complex showing that the system responds to an external force by two mechanisms depending on the pulling (loading) rate. It was however concluded that the unfolding of the protein was not coupled to the adhesive function of the receptor ligand complex. This therefore permits on a first approximation the modelling of molecular rupture by just taking into consideration the nature of the interaction potential between the two molecules and a response interaction based on how the pulling is being carried out.
Model
Top |
Where Hummer and Szabo have used a very simple potential for their study while comparing with the experimental unfolding of the titin molecule, we hereby decided to use the Lennard-Jones potential as the potential form of the inteaction with an effective spring constant (k=km + kc , as in Figure 3 below) to imitate the springiness and response of the molecule in a single molecular bond rupture experiment. They have made approximations in their calculations in order to avoid the complexity of the analytical solution for their simple model, while we are depending on computer simulations to scale the different regimes by a modification of the timestep of the simulation. We have also introduced a random noise in the system to imitate the brownian contribution of the local environment of a molecule to its motion.
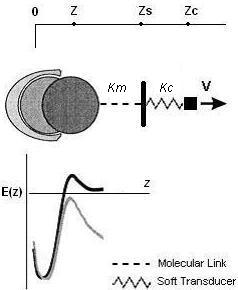 Fig 3
Fig 3
The system is analysed within high and low pulling regimes and the trend of the rupture force with respect to time is obtained.
Simulation
The langevin equation which is used to obtain the dynamics of this system,

The Lennard-Jones parameters used were sigma= 1nm and epsilon= 5kT . Reduced units were used in our code for efficiency and easy analysis of the results. The timestep was constructed to be non-constant, depending on the proximity of the anchored molecule to the rupture distance. This is done such that the initial stages of the run are computes at larger steps which gets smaller as the rupture distance is approached. The random noise is supplied by a uniform random number generator (ran1, numerical recipes) and transformed by the Box-Mueller method algorithm (gasdev) which generates a random deviates of standard normal distribution. A variable transformation is then performed on each call x = x' times s where s is the desired variance of value s = sqrt(2Dt) in accordance with the random noise of the langevin equation.
 Fig 4
Fig 4
Each simulation (per pulling velocity) was done within 10^8 steps due to the limitation of the random number generator ran1. 10 runs per velocity were carried out in order to reduce statistical error in the results. The rupture was observed from the trace of the force and the trace of the instantaneous position of the pulled molecule. This event is characterized by a change in slope of either quantity.
Results Top |
Figure 5 is a typical plot of position v.s. time.
It's easy to tell the rupture time from the plot by the discontinuity in the slope.
Figure 6 shows the average rpture forces as a function of the loading rates.
The rupture force measured is an increasing function of the loading rate. At high loading rates, the rupture forces are comparable to the maximum force corresponding to the LJ potential.
We also did the simulations of the average rupture forces for different E0, i.e. the potential detween the ligand and the receptor. The results are showed in Figure 7 . On the other hand, by fitting the experiment results, our model provides a way to get the potential energy in the molecular bond.
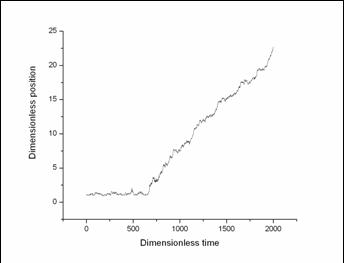
Fig 5
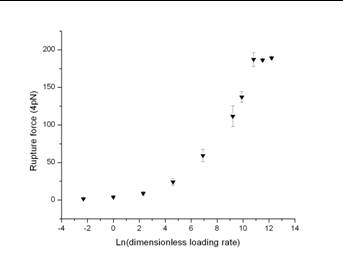
Fig 6
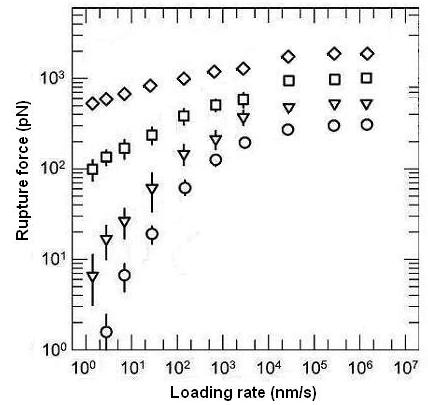

Fig 7
The model predicts, as it is observed experimentally, the rupture force measured as an increasing function of the loading rate.
At high loading rates, the rupture forces are comparable to the maximum force corresponding to the LJ potential.
This kind of rupture is due to the the rapid increased force which eliminates the energy barrier
rather than to move the particle.
At low loading rates,
the time needed to reach the maximum resistant force in the potential well is very long,
so that the thermal fluctuation could develop long and play an important role in producing the rupture. The thermal fluctuations take an important role in the detachment process at low loading rates.
Futurework
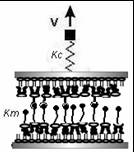
Fig8
For rupture of multiple parallel molecular bonds under dynamic loading, the bonds number are time dependent. We need to do simulation for the laoding process by using our single molecular bond rupture model as an element.
References
1) Evan Evans, "Probing the relation between force-lifetime-and chemistry in single molecular bonds" , Annu. Rev. Biophys. Biomol. Struct. 30 (2001) 105-28
2) Hummer and Szabo, "Kinetics from Nonequilibrium Single-Molecule Pulling Experiments", Biophys. J 85 (2003) 5-15
3) Smith et al, " Direct Measurements of the Elasticity of Single DNA Molecules by Using Magnetic Beads", Science 258 (1992) 1122-1126
4) Bayas et al, " Forced Detachment of the CD2-CD58 Complex", Biophys. J. 84 (2003) 2223-2233