Hydrogen Effect on Shear
Deformation of Ni
By Deok
Chan Ahn and Teck Leong Tan
Hydrogen embrittlement is a critical issue in engineering metals. The presence of hydrogen often causes the originally ductile metal to fail in a brittle manner. Such brittle failures are undesirable and must be avoided in engineering applications. As a result, there have been considerable experiments and theoretical efforts to understand how hydrogen embrittlement occurs.
Various mechanisms had been proposed including hydrogen enhanced decohesion (HEDE) [1] and hydrogen enhanced localized plasticity (HELP) [2]. In the former mechanism, it is believed that hydrogen diffuses into the grain boundaries and/or the interfaces between impurities and metal matrix. The solute hydrogen then causes the segregation of grains and/or impurities from metal matrix. As for HELP, even though metals are macroscopically embrittled by hydrogen, it is observed that the failure is microscopically ductile [3-4]. The presence of hydrogen is believed to have the effect of decreasing the interaction energy between dislocations. This effect of shielding by hydrogen atoms increases dislocation mobility and hence enhances the localized plasticity.
Thus far, experimental studies are inconclusive as to the dominant mode of hydrogen failure with scanning electron microscopy (SEM) supporting the HEDE model and transmission electron microscopy (TEM) supporting HELP, as pointed out in [5]. A number of atomistic simulations had also been done to study the various aspects of hydrogen effects such as trapping of hydrogen atoms [5] and the effect on void growth [6]. These studies are in general suggestive of both mechanisms. Hence, there is still much work to be done before a conclusion could be reached.
The goal of our project is to quantify the effect of hydrogen on the plastic deformation of Ni crystal at the atomic scale. Our model is set up in a manner whereby the effect of hydrogen on the simple shear deformation can be studied. Unlike previous studies, we focus on the influence of hydrogen upon dislocation emission and the plastic deformation behavior of Ni crystal. We begin by summarizing the EAM method [7-8] in section 2 which provides the fundamental basis for our simulations. The details of the computational setup are found in section 3. In section 4, the molecular dynamics simulation results of a single Ni crystal (no periodic boundary condition) and of a bulk Ni crystal (with periodic boundary conditions in the x and z directions) under simple shear are presented for the cases of pure Ni and Ni-H system. In order to study the effect of hydrogen, we investigate the deformed shapes of the crystal and the reaction stress vs. strain relation. Finally, in section 5 the discussion and summary of our project are presented.
One of the important components of a molecular dynamics (MD) simulation is the choice of interacting potential. Ideally, we would like to simulate the largest system possible with the most accurate potential available. However, accurate 1st principle calculations are computationally intensive and the simulation of even a few hundred particles requires a large computational resources. The empirical Lennard-Jones potential, on the other hand, is much simpler and simulation up to a million particles is possible with a reasonable amount of resources. However, the L-J potential falls short of representing the interactions within metals, since the interactions in metals are not simply pair-wise. In metals, the valence electrons are delocalized and participate in metallic bonding. The embedded atom method (EAM) was thus invented by Daw and Baskes to incorporate this contribution by the valence electrons to bonding [7, 8]. The EAM is semi-empirical in nature and is not much more computationally expensive as compared to the L-J potential. This enables us to perform calculations of a large number of particles within a reasonable time. The EAM will be outlined below and the interested reader is directed to the comprehensive review by Daw et. al. [9].
In the EAM, the total energy of a configuration of atoms is given as:
![]() (1)
(1)
where rh,i is the electron density at the atom i contributed by all of the other atoms in the system. Fi (rh,i) is the embedding energy of atom i which depends only on the host (all other atoms except i) electron density rh,i at atom i. The component, fij(rij), is a pair energy term between atoms i and j, separated by a distance rij.
In its original implementation, the pair interaction component is given by a Columbic-like repulsive term [8]:
![]() (2)
(2)
Zi (r) and Zj (r) are the effective charges of atom i and atom j respectively. It is noted that the effective charge is dependent on the separation of the two atoms, r. Z(r) of metals could be obtained by fitting experimental data to the following form [10]:
![]() (3)
(3)
where Z0 takes the charge of the atom without its valence electrons (e.g Z0,Ni =10). b, n and a are parameters to be fitted. The atomic electron density is then given by the following [8, 10], computed from the Hartree-Fock wave functions:
![]() (4)
(4)
Here, it is illustrative to consider a specific metal say Ni. In the above equation, N is the total number of electrons (N=10 for Ni) and Ns is an empirical parameter which corresponds to the s-like content of the atomic density. Ns can be obtained by fitting to the heat of solution of say, hydrogen, in Ni. Since Ni has the outer electronic configuration of 3d8 4s2 (ground state), N-Ns gives the effective number of d-like electrons in the atom. The atomic densities rs and rd were taken from calculations by Clementi et. al. [11] based on single-determinant Hatree-Fock theory.
Finally, the embedding energies and pair interactions of the metal are fitted to various bulk properties: lattice constant, sublimation energy, elastic constants and vacancy formation energy. It is also pertinent to highlight that in their work on hydrogen dissociation in Ni, Foiles et. al. [12] gave the following forms for the EAM functions of hydrogen:
![]() (5)
(5)
![]() (6)
(6)
Here, f1, f2, f3, f4, Z0 and a are all fitting parameters. The various interactions in the Ni-H system are shown in figure 1.
It should also be noted that the above empirical forms and fitting procedures are not the only way in which the EAM can be implemented practically. The use of an attractive potential or Morse-like potential for the pair interaction is equally justified. This results in only a linear change in the embedding energy and the final expression of equation (1) is equally valid [9]. The fitting procedure may also differ and the work by Foiles et. al. [5] showed that the embedding energy could be obtained by fitting the total energy to the Rose equation of state.
Lastly, with the energy of the system calculated, the force acting on a particular atom is given as [8]:
![]() (7)
(7)
where ![]() is the force on the kth atom and
is the force on the kth atom and ![]() is the unit vector between the jth
and kth atoms. F’, r’ and
f’
denotes dF/dr , dr/drjk and df/drjk
respectively. The
acceleration of each atom, which is required in MD simulations, is then
obtained easily by:
is the unit vector between the jth
and kth atoms. F’, r’ and
f’
denotes dF/dr , dr/drjk and df/drjk
respectively. The
acceleration of each atom, which is required in MD simulations, is then
obtained easily by:
![]() (8)
(8)
where ![]() is the acceleration of the kth
atom.
is the acceleration of the kth
atom.
Fig. 1. The EAM consists of 2 components, the embedding energy (left) and the pair interaction energy (right). The EAM shown here is for the study of hydrogen dissociation in Ni [12].
3.1 MD code
The aim of our project is to evaluate the effect of hydrogen on the plastic deformation of Ni at the atomic scale. As such, an MD simulation with EAM would be appropriate. Our team was able to source for the MD code, Dynamo, which is authored by S. M. Foiles and M. S. Daw from Sandia National Laboratories [13]. Dynamo was written specifically to do simulations with EAM and it contains the EAM potentials for Ni and H. The nature of the EAM is similar to what we had discussed and its exact formulation is given in [14]. Dynamo uses the Nordsieck integrator to advance the system in time which is actually a 2nd –order Gear predictor-corrector method (2nd order refers to the actual Newtonian equation being solved during MD simulation). The interested reader may refer to [15] for further details on the Gear predictor-corrector method.
3.2
Computational setup
3.2.1 Single
Ni crystal model
In our project, simple shear deformation of pure fcc Ni is first studied. This is followed by another simulation with hydrogen atoms dispersed randomly in the Ni system. The deformation patterns and the reaction force at the moving boundary for the 2 cases are compared. The initial temperature was set to be 10K. No temperature and pressure control was used. Our MD simulations were performed on the box system of an initial size of 3.17 x 3.24 x 1.49 nm3 (figure 3) with 1682 atoms. No periodic boundary condition was applied, therefore all the boundaries in the x, y, and z directions are considered to be free surfaces. Following the MD simulation of the simple shear deformation of Ni in [16], the x, y and z axes were aligned to the [100], [011] and [0 -1 1] directions of the fcc lattice respectively. The system was generated by placing the Ni atoms in the fcc lattice (a= 3.52 angstroms) with their velocities (except for the surface layers) following the Boltzmann distribution at 10K. The atoms at the top and bottom layer of the system were fixed along the xyz-direction. The simulation process is divided into two separate procedures. Firstly, the static equilibrium position was found using the energy minimization function of Dynamo. This procedure provided good initial conditions for the subsequent dynamic analysis.
Next, the dynamic simulation was carried out with the initially equilibrated atomic positions. The top layer was displaced in the x-direction at the velocity of 2m/s. This corresponds to the strain rate of 6.25 x 10⁸ s-1 and the time step was set to be 2 femto second. The total simulation was carried out up to 400 pico seconds. In the case of the inclusion of hydrogen, the 1% H atoms (relative to the total number of Nickel atoms) were placed randomly at interstitial sites, namely, octahedral and tetrahedral sites of the fcc lattice (figure 5).
Fig. 2: Boundary condition and the velocity of moving boundary.
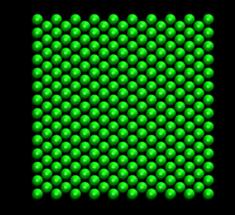
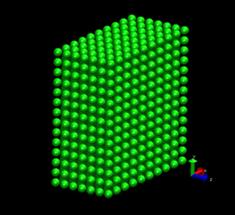
Fig. 3: FCC nickel crystal used for simulation (1682 atoms). Left: A planar view of the superposed layers along z-direction. Right: An isotropic view of the model.
3.2.2 Bulk
Ni crystal model (xz-periodic boundary condition)
By
applying the xz-periodic boundary condition (i.e. the
system is periodic in the x and z directions), we examine the effect of
hydrogen on the bulk Ni deformation.
All the numerical setup is identical as mentioned above for the single
crystal case. The box size for the
bulk system is 3.17 x 3.24 x 1.76 nm3 with 1701 atoms. The time step was set to be 1 femto second and the total simulation time was 400 pico seconds.
For a single Ni crystal, 5 cases were simulated with 5 different random seeds for the initial Boltzmann velocity distribution for both the pure Ni and the Ni-H system. For the bulk crystal model, 2 simulations were carried out for both the pure Ni and Ni-H system. During simulations, the intermediate values of the atomic positions and forces were obtained. The atomic positions allow us to visualize the deformation occurring in the system using the visualization software VMD [17]. The total reaction force on the atoms in the top layer was computed by
 .
(9)
.
(9)
4.1 Single
Ni crystal
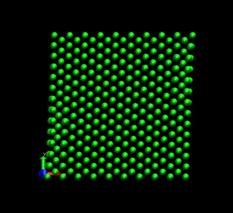
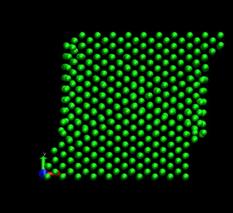
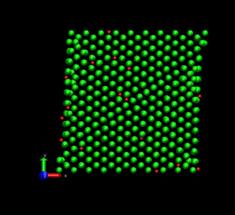
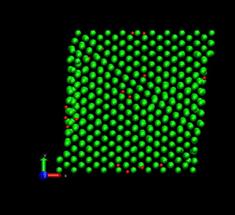
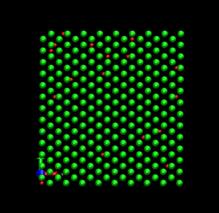
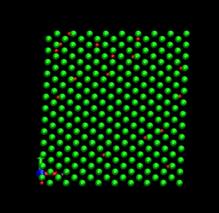
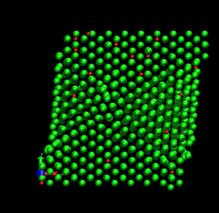
Figure 4 shows the deformed shape of a pure Ni crystal at several values of shear strain (h/H, see figure 2). As the top layer moved right, the crystal was deformed into a parallelogram and at time of 133 ps, an edge dislocation was created at the left lower corner where the severe stress concentration occurred and this propagated diagonally from the lower left corner to the upper right corner along the (111) plane. As soon as the dislocation was emitted, the shear stress decreased rapidly as plotted in figure 6. Then, the crystal was restructured and the shear stress increased again. As the top layer continued to move towards the right, another glide plane joining the lower right corner to the upper left was activated and dislocations propagated throughout the crystal. When hydrogen was introduced, the general deformed shapes of the crystal (figure 5) remained rather similar to those of the pure crystal. Initially, 3 hydrogen atoms among 17 were distributed in the free surfaces. As the simulation time elapsed, more than two thirds of hydrogen atoms diffused to the free surfaces at 100 ps. Figure 6 shows the reaction forces exerting on the top boundary layer. The average value of the maximum shear stress is reduced by the presence of hydrogen. In the case of pure Ni the maximum shear stress is 6.71±0.088 GPa at shear strain of 0.0764 and in case of the Ni-H system the maximum shear stress is 6.1±0.39 GPa at shear strain of 0.0808.
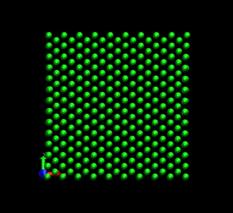
time=16 ps, h/H=0.0096 time=80 ps, h/H=0.049
time=128 ps, h/H=0.079 time=144 ps, h/H=0.089
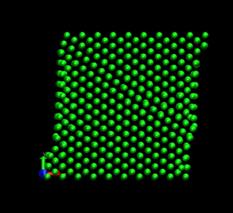
time=224 ps, h/H=0.138 time=400 ps, h/H=0.246
Fig. 4. Deformed shapes of fcc Ni single crystal at several time steps.
time=16 ps, h/H=0.0096 time=80 ps, h/H=0.049
time=128 ps, h/H=0.079 time=144 ps, h/H=0.089
time=224 ps, h/H=0.138 time=400 ps, h/H=0.246
Fig. 5. Deformed shapes of fcc Ni-H single crystal at several time steps. Green spheres denote Ni atoms and red spheres denote hydrogen atoms.
Fig. 6. Reaction stress at the top layer boundary of the single Ni crystal model. The dip in the shear stress corresponds to the yielding point where the first dislocation is formed completely.
4.2 Bulk Ni
crystal (xz-periodic boundary condition)
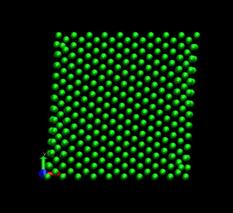
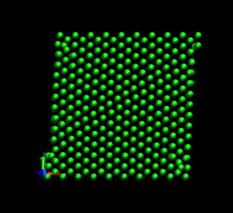
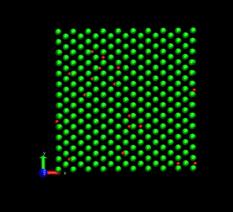
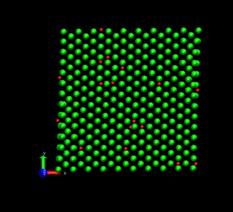
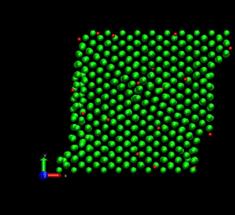
In the case of bulk Ni, the maximum shear stress is approximately 3.6 times larger than that of single crystal as shown in figure 8. The values of maximum shear stress for pure Ni and Ni-H are 23.9 GPa at shear strain of 0.1835 and 22.9 GPa at shear strain of 0.1755 respectively. On the bulk Ni-H system, the hydrogen atoms did not move to the boundaries of the simulation box. In Figure 7, we observe that the hydrogen atoms reside in their initial interstitial sites during the deformation of the crystal.
time=16 ps, h/H=0.0096 time=80 ps, h/H=0.049
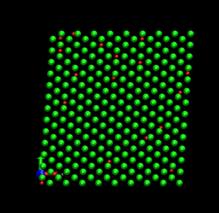
time=128 ps, h/H=0.079 time=256 ps, h/H=0.158
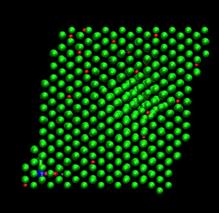
time=272 ps, h/H=0.167 time=400 ps, h/H=0.246
Fig. 7. Deformed shapes of fcc Ni-H bulk crystal at various time steps. Green spheres denote Ni atoms and red ones refer to hydrogen atoms.
Fig. 8. Reaction stress at the top layer boundary of the bulk Ni crystal model. For pure bulk Ni and bulk Ni-H system, two simulations were computed for both cases.
4.3 Analysis
of energy plots
The potential and kinetic energies of the single Ni model were plotted against time. Looking at the case for pure Ni, we observed a series of ‘jumps’ in both the potential and kinetic energies (figure 9). The P.E plot has an increasing trend while the K.E fluctuates about a certain mean value between each jump. Each of these jumps (upwards for K.E and downwards for P.E) corresponds to the formation of a dislocation. When a dislocation is formed the crystal relaxes, resulting in a drop in P.E and a corresponding increase in K.E. We see that for the case of pure Ni, the first dislocation was formed at around 130 ps. The plots for the Ni-H system are plotted in figure 10. In this case, both the P.E and K.E showed increasing trends and intermittent jumps corresponding to dislocation formations are present, too. In addition, the general trend of the K.E plots between the 2 systems differs, with the Ni-H system showing a more continuously increasing trend.
Fig. 9 Energy plots of pure Ni system (single crystal model)
Fig. 10. Energy plots of Ni-H system (single crystal model)
5. Discussion
and Summary
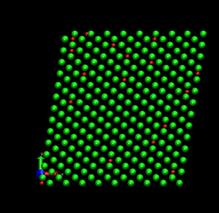
The order of the maximum shear stress predicted for pure Ni compares well with the former work on the simple shear of pure Ni crystal (~10 GPa)[16]. The discrepancy between the stress values is believed to be due to the different computational setup such as the applied shear strain rate, the dimensions of the crystal model, boundary conditions, and potential description. The shear stress vs. shear strain plot for the single crystal model in figure 6 shows that 1% hydrogen atoms (17 atoms) reduce the maximum stress (6.7 Gpa) by about 0.6 GPa. In addition, figure 6 shows that as the shear stress goes closer to the maximum value, it oscillates more. This phenomenon is believed to be the fact that a major portion of hydrogen atoms moves to the surface. This induces then the expansion of free surfaces shown in figure 11 which can results in the stress relaxation inside the crystal. As an analogy, we can imagine that the stress of a metal bar in tension decreases if we heat up the bar since the thermal expansion of the bar negates the stress introduced by tension.
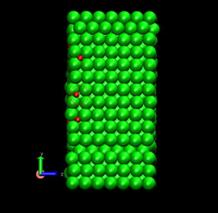
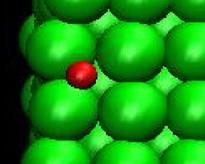
Fig. 11. Deformed shapes of fcc Ni-H single crystal model at time=144 ps, shear strain (h/H)=0.089. Green spheres denote Ni atoms and red ones, hydrogen atoms. Right figure is the magnification of the circle area of left figure.
In the case of bulk crystal model, the maximum shear stress (23.9 GPa) is observed to be approximately 3.6 times that of the single crystal model (6.7GPa). Generally, this value is quite unreasonably large. We believe that the xz periodic boundary condition for bulk Ni constrains the motions of atoms so tightly. Nevertheless, it is worthy to note that during simple shear deformation as shown in Fig. 7, most of the hydrogen atoms reside within Ni crystal and the maximum shear stress decreases as in Fig. 8 (22.9 GPa). A similar possible mechanism, as mentioned in the single crystal model case, is that hydrogen atoms inside Ni crystal induce volumetric dilatation locally and this interacts with the fixed boundaries reducing the maximum stress. In addition, since the fluctuation of shear stresses is so large after crystals deformed plastically, it is somewhat difficult to quantify the extent of local plastic deformation due to the presence of hydrogen atoms, as suggested by the HELP mechanism.
In this project, we have demonstrated that hydrogen decreases the maximum shear stress of Ni crystal and enhances the dislocation emission. In the case of single Ni crystal model, the maximum shear stress (6.7 GPa) decreased 9 % under the presence of 1% hydrogen atoms. For bulk Ni crystal, 4 % reduction of the maximum shear stress (23.9 GPa) was observed. In the present study, the simulations were performed on initially perfect crystals. In the future, it is recommended to study on crystals with defects such as vacancies, dislocations, and etc. under hydrogen environment. This will be much more interesting and important for understating more realistic material behavior. As a final note, we suggest that careful investigations on various boundary conditions should be carried out.
Acknowledgement
We
are indebted to Professor Murray S. Daw, Department
of Physics and Astronomy at
[1] Gerberich,
W. W., March, P., Hoehn, J, Venkateranman,
S. and Huang, H. (1993) Proc. Int. Conf. on Corrosion-Deformation
Interactions (1993) ed T. Magnin and J. M. Gras (
[2] Birnbaum, H. K. (1990) Hydrogen Effects on Material Behavior ed. N. R. Moody and A. W. Thompson (warrendale, PA:TMS), p.639, and references therein
[3] Thompson, A. W., Bernstein
[4] Hanninen,
H. E., Lee, T. C., Robertson,
[5] Angelo, J. E.,
Moody, N. R., Baskes, M. I., (1995), Modelling Simul. Mater. Sci.
[6] Somerday, B. P., Pattillo II, P. D., Horstemeyer, M. F., Baskes, M. I., (2000), Mat. Res. Soc. Symp. Proc. Vol. 578, p333
[7] Daw, M. S., Baskes, M. I., (1983), Phys. Rev. Lett. 50, p1285
[8] Daw, M. S., Baskes, M. I., (1984), Phys. B 29, p6443
[9] Daw, M. S., Folies, S. M., Baskes, M. I., (1993), Mater. Sci. Rep. 9, p251
[10] Foiles, S. M., Baskes, M. I., Daw, M. S., (1986), Phys. Rev B 33, p7983
[11] Clementi, E., Roetti, C., (1974), Atomic Data and Nuclear Data Tables (Academic, New York, 1974), vol. 14. Nos. 3 and 4.
[12] Foiles, S. M., Baskes, M. I., Melius, C. F., Daw, M. S., (1987), Jour. Less-Common Met. 130, p465
[13] Foiles,
S. M., Daw, M. S. (1994), Dynamo code, (Sandia National Laboratories in
[14] Daw, M. S., Baskes, M. I, Bisson, C. L., Wolfer, W. G, (1986), Modeling Environmental Effects on Crack Growth Processes, (Edited by R. H. Jones and W. W. Gerberich), p99
[15] Allen, M. P., Tildesley, D. J., (1990), Computer Simulations of Liquids, (
[16] Horstemeyer M.
F.., Baskes M. I., Prantil
V. C., Philliber J., Vonderheide
S., (2003), Modelling Simul. Mater. Sci.
[17] Humphrey, W., Dalke, A. and Schulten, K., (1996), J. Molec. Graphics, 14.1, p33-38.