3D KMC
simulation on the precipitation in the annealed ternary alloy system
Xuan Zhang, Mengqi Huang
Abstract
Kinetic
- Introduction
Precipitate hardening is widely used to increase the yield strength of alloys. However, this strengthening mechanism depends on the size of the precipitates. The critical radius is typically 5~30 nm [1]. Those larger precipitates will bent the dislocations rather than cutting through them, which decreases the strength of the material [2]. Considered the fact that precipitates will grow during heat treatment, normal alloys will lose their strength at high temperature. Therefore, reducing the size of the precipitates, especially at high temperature, is desired to improve the mechanical property of the alloys.
Cu-Nb alloy (10 at.% Nb) were found to lose the strength because of the
formation of large precipitates (40~80 nm) at
The XRD results in Fig. 1are kind of interesting, and it is possible to
get some important information about how the kinetics is when this material is
subjected to thermo annealing. Samples were treated in three different
conditions: (1) direct annealing at 600![]() for 2 hours; (2) first annealing at 600
for 2 hours; (2) first annealing at 600![]() for 2hrs, then annealing at 700
for 2hrs, then annealing at 700![]() for 2 hours; (3) direct annealing at 700
for 2 hours; (3) direct annealing at 700![]() for 2 hours. Under condition (1), two peaks besides the Cu
peak are observed: one at pure Nb position, and the other is in between the
peak position of Nb and W, which suggests Nb-W alloy particles are formed, and
the average particle size and concentration can be get from the half-maximum
width and position of the peak, respectively. Under condition (2), two things
happened compared with condition (1), which are, first, the alloy particle peak
shift significantly to W peak side, and second, pure Nb peak grew. Under
condition (3), only the alloy particle peak is observed besides the Cu peak.
for 2 hours. Under condition (1), two peaks besides the Cu
peak are observed: one at pure Nb position, and the other is in between the
peak position of Nb and W, which suggests Nb-W alloy particles are formed, and
the average particle size and concentration can be get from the half-maximum
width and position of the peak, respectively. Under condition (2), two things
happened compared with condition (1), which are, first, the alloy particle peak
shift significantly to W peak side, and second, pure Nb peak grew. Under
condition (3), only the alloy particle peak is observed besides the Cu peak.
Since the two facts that (1) W is miscible with Nb [4],
but has a positive heat of mixing with Cu [5],
and (2) W start to be mobile above
In order to prove our assumption, we use KMC simulation to study the dynamic evolution of the precipitates in a simplified ternary alloy system. First we will find out the proper parameters so that our simplified KMC code can qualitatively present real materials; then we will compare our 2-step annealing simulation results with the XRD spectrums.
Fig. 1.
XRD results for different annealing conditions.
- KMC approach
2.1 KMC introduction
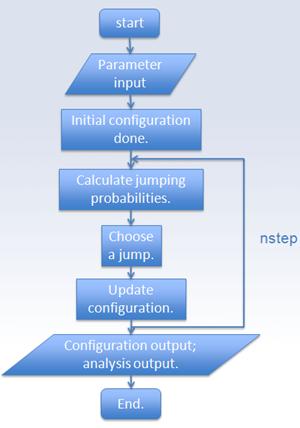
Kinetic Monte Carlo (KMC) is widely used to study diffusion-controlled phenomena, and its main advantage is that it has a good compromise between the atomic scale mechanism and the macroscopic time scale. Given a system with initial configuration, and a set of transition rate between different configurations, the evolution of the system can be studied [6].
2.2 Flowchart
2.3
KMC model
The goal of this project is to build a
system that can best describe the Cu-Nb-W ternary alloy system. The simulation
box is set to have 64*64*64=262144 atoms in total, with a fcc crystal structure.
There is one and only one vacancy in the box. In the binary system, we choose
90 at% type A atoms and 10 at% type B atoms, and in the ternary system, we replace
1 at% of A to C atoms, thus having a ![]() system. Only first
nearest neighbor interaction is considered. The exchanging rate between vacancy
and its neighbors is determined by the local environment and the saddle point
energy of that atom, i.e. when exchanging happens, the atom and vacancy need
first to break all the bonds they have with the local environment and then the
atom jumps to the saddle point position, then to the former vacancy position.
system. Only first
nearest neighbor interaction is considered. The exchanging rate between vacancy
and its neighbors is determined by the local environment and the saddle point
energy of that atom, i.e. when exchanging happens, the atom and vacancy need
first to break all the bonds they have with the local environment and then the
atom jumps to the saddle point position, then to the former vacancy position.
The energies envolved are energies of the
bonds (![]() ) and the saddle point energies
) and the saddle point energies![]() (it is assumed the same type of atoms have the same saddle
point energy). The saddle point energies are set to be input, based on
the value for pure A system with just one vacancy (-10.217eV). The rest of the
energies are calculated in the code, based on the cohesive energy of pure A, B,
C systems (
(it is assumed the same type of atoms have the same saddle
point energy). The saddle point energies are set to be input, based on
the value for pure A system with just one vacancy (-10.217eV). The rest of the
energies are calculated in the code, based on the cohesive energy of pure A, B,
C systems (![]() ), the ordering energy between AB, AC and BC (
), the ordering energy between AB, AC and BC (![]() ), and vacancy formation energy in pure A, B, C (
), and vacancy formation energy in pure A, B, C (![]() ). They are set to be input and their values are chosen to
be:
). They are set to be input and their values are chosen to
be: ![]() (experimental data for
pure Ni),
(experimental data for
pure Ni), ![]() (considering the fact
that C represents tungsten, whose bonds are stronger than A and B),
(considering the fact
that C represents tungsten, whose bonds are stronger than A and B), ![]() [7]
(typical experimental data for Cu-Co system),
[7]
(typical experimental data for Cu-Co system), ![]() ,
, ![]() (considering the fact
that Cu and Nb only have a slightly positive heat of mixing but Cu and W have
very large positive heat of mixing, and that of Nb and W is generally
negligible since Nb and W are miscible.),
(considering the fact
that Cu and Nb only have a slightly positive heat of mixing but Cu and W have
very large positive heat of mixing, and that of Nb and W is generally
negligible since Nb and W are miscible.), ![]() (experimental data for
pure Cu [8],
but this value has finally been adapted for the reason related to the time
scale, see section 3.1.). All parameter needed in our code are listed in
Table.1.
(experimental data for
pure Cu [8],
but this value has finally been adapted for the reason related to the time
scale, see section 3.1.). All parameter needed in our code are listed in
Table.1.
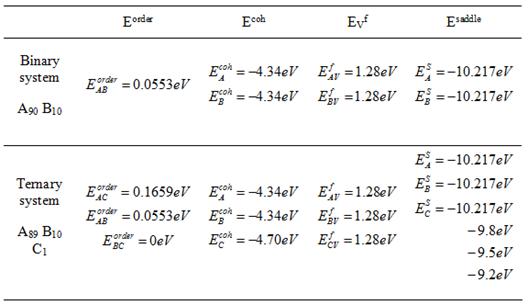
Table. 1. All the energy parameters for
KMC model.
- Results and discussion
3.1 Real time scale: determination of EVf
The vacancy formation energy determines the
relationship between KMC simulation step and real time. For real material, the
vacancy concentration at thermal equilibrium is about 10-10~10-14.
In our model, we increase it to ![]() . Accordingly, more atom-vacancy exchanges occur in the model,
which means our KMC simulation is much faster than real time experiments. The
ratio between real time and KMC time is a function as temperature:
. Accordingly, more atom-vacancy exchanges occur in the model,
which means our KMC simulation is much faster than real time experiments. The
ratio between real time and KMC time is a function as temperature:
![]()
Where XVeq is the vacancy concentration at thermal equilibrium:
![]()
Table 2 lists several A values at different temperatures, if we assume all
the vacancy formation energy are the same, e.g. ![]() (The reason for this assumption will be discussed below). Based
on these parameters, four annealing simulations were run for 4*1010
KMC steps in a temperature range from 100℃
to 500℃. By scaling to the real
time scale, the changes of the average particle sizes with time for both binary
and ternary systems are plotted in Fig. 2. It is shown that the ternary system
has much smaller precipitates (~103 atoms) than the binary system
(~104 atoms). The relation between adding tungsten and the decrease
of particle size will be discussed more later.
(The reason for this assumption will be discussed below). Based
on these parameters, four annealing simulations were run for 4*1010
KMC steps in a temperature range from 100℃
to 500℃. By scaling to the real
time scale, the changes of the average particle sizes with time for both binary
and ternary systems are plotted in Fig. 2. It is shown that the ternary system
has much smaller precipitates (~103 atoms) than the binary system
(~104 atoms). The relation between adding tungsten and the decrease
of particle size will be discussed more later.
Fig. 2 also illustrated a fact that the lower the annealing temperature,
the more time it will take to form comparable size particles as higher
temperature. If we choose a slightly different vacancy formation energy (e.g.
1.6eV), the new A values will yield much longer nucleation time: for 500℃ t~30h,
and t~2700h for 400℃. Compared
with real annealing experiments, ![]() is a more reasonable choice
for our model.
is a more reasonable choice
for our model.
|
T(℃) |
100 |
300 |
400 |
500 |
|
A |
6.9E11 |
6.7E5 |
1.5E4 |
821 |
Table 2. Values
of the ratio A at different temperatures.
(b) (a) Ternary A89 B Binary A90 B10
(d) (c) T=300℃
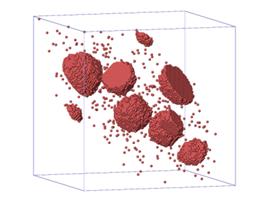
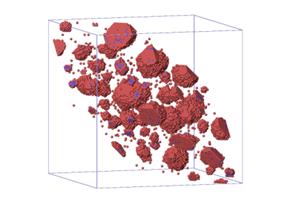
Fig. 2. (a) and (b) show average particle
size as a function of real time at different temperatures: (a) is for binary
system, (b) is for ternary system. (c) and (d) are visualization pictures of
the alloy structures for both systems at T=300℃. The red dots
are Nb atoms, the blue ones are W atoms. Both (c) and (d) are plotted from the
final time step (~108 s), when <n> changes with time very
slowly.
3.2 Precipitate size vs. time
As shown in Fig. 2, the average precipitate size of the ternary alloy is much smaller than that of binary alloy, approximately one order of magnitude lower when the rest of the parameters are set to be the same. It is also found that the two systems follow different growth law—the slop of Fig. 2(a) is higher than that of Fig. 2(b). This phenomenon agrees quite well with what we found in experiment, i.e. the third element behaves like a controller to the precipitate growth.
3.3 ![]()
To provide a quantitative description of the mobility of atoms, the five-frequency model 9 is adopted. The schematic diagram of Figure.3 shows the five different frequencies for vacancy jump in an infinite dilute solution if only first n. n. is considered. To be simple, w0 is the unperturbed host atom-vacancy exchange frequency, w1 is the frequency that vacancy jumping around the solute atom, w2 is the solute atom-vacancy exchange frequency, w3 is the dissociation frequency of the solute atom and the vacancy, and w4 is the association frequency of the solute atom and the vacancy. By calculating the relative energy for each type of jump, those five frequencies are determined by the following equation:
![]()
Where ![]() is the base frequency
which is set to be
is the base frequency
which is set to be ![]() by input, and
by input, and ![]() . Figure shows the relation between w2 and
. Figure shows the relation between w2 and ![]() at 300
at 300![]() , assuming only one C atom in a pure A matrix. Since w2 is
the direct C-V exchange frequency, the lower the value, the less the mobility
of C.
, assuming only one C atom in a pure A matrix. Since w2 is
the direct C-V exchange frequency, the lower the value, the less the mobility
of C.
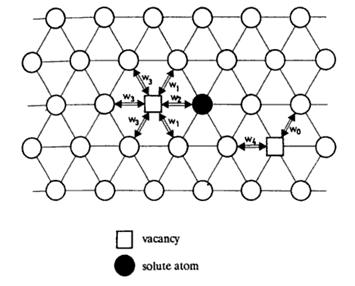
Figure. 3. Five-frequency model for
vacancy jumps in the presence of a foreign atom, showing (111) plane. [9]
Figure. 4. The frequency of the exchange between the
solute atom and the vacancy as a function of the saddle point energy of atom C.
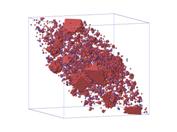
From Figure.4 we can see that when ![]() , w2 is so low that C atoms are indeed immobile at 300
, w2 is so low that C atoms are indeed immobile at 300![]() . This trend can also be seen from Figure.5, which is the
visualizations of microstructures at the same real time for the four different
. This trend can also be seen from Figure.5, which is the
visualizations of microstructures at the same real time for the four different ![]() .
.
(a)
(b)
(c) (d)
Figure.5. Visualization of
microstructure of precipitates at four different saddle point energy of atom C:
(a) ![]() ; (b)
; (b) ![]() ; (c)
; (c) ![]() ; (d)
; (d) ![]() .
.
In our
experiment, when we first annealed the sample at 600![]() , tungsten should be immobile
based on the experimental data from Cu-W binary system, and when we annealed
the sample at 700
, tungsten should be immobile
based on the experimental data from Cu-W binary system, and when we annealed
the sample at 700![]() , tungsten should starts to be mobile. Because our simulation
does not mean to reproduce everything in experiment, we just chose
, tungsten should starts to be mobile. Because our simulation
does not mean to reproduce everything in experiment, we just chose ![]() and chose
and chose ![]() to be the condition
similar to
to be the condition
similar to ![]() in experiment. Further
we found out that at
in experiment. Further
we found out that at ![]() in our simulation, C atoms starts to be mobile, which is
kind of the case that happened in experiment at 700
in our simulation, C atoms starts to be mobile, which is
kind of the case that happened in experiment at 700![]() . These are the simulation condition we use in the following
part.
. These are the simulation condition we use in the following
part.
3.4 Modeling of experiments
Based on the analysis above, we chose three conditions as a reflection
of experimental conditions: anneal at 300![]() , anneal at 300
, anneal at 300![]() then anneal at 500
then anneal at 500![]() , anneal at 500
, anneal at 500![]() . Any of the temperatures has been maintained for relatively
long enough time to have distinguishable configurations and reach a
quasi-steady state, since in the annealing situation, if waiting long enough,
the final equilibrium state is just one big BC particle in A matrix, and this
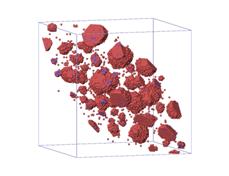
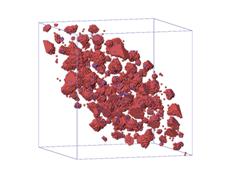
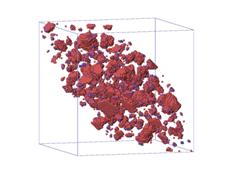
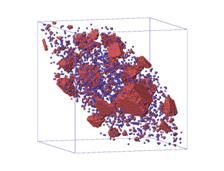
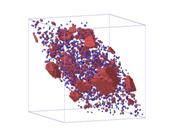
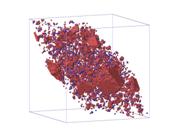
is obviously not what we want. Figure.6 shows the visualizations of
microstructures in the three conditions. Different atom distributions and particle
size distributions are observed.
. Any of the temperatures has been maintained for relatively
long enough time to have distinguishable configurations and reach a
quasi-steady state, since in the annealing situation, if waiting long enough,
the final equilibrium state is just one big BC particle in A matrix, and this
is obviously not what we want. Figure.6 shows the visualizations of
microstructures in the three conditions. Different atom distributions and particle
size distributions are observed.
(a)
(b)
(c)
Figure.6. Visualization of microstructures of precipitates under three
different conditoins: (a) directly annealing at 300![]() ; (b) first annealing at 300
; (b) first annealing at 300![]() , then annealing at 500
, then annealing at 500![]() ; (c) directly annealing at 500
; (c) directly annealing at 500![]() .
.
|
|
annealing temp (C) |
Amount of B in matrix |
Amount of C in matrix |
|
1 |
300 |
5% |
69% |
|
2 |
300+500 |
<13% |
<50% |
|
3 |
500 |
<11% |
<41% |
Table.3. Distribution
of B and C atoms under three different conditions.
|
Annealing
temp (C) |
ntot |
<natom> |
|
300 |
22 |
1170 |
|
300+500 |
34 |
726 |
|
500 |
82 |
298 |
Table.4. The
total number of precipitates and the average size (the average number of atoms
in particles) under three different conditions.
Table.3 shows the atom distribution in each condition, and Table.4 shows
the total number of particles and their average size (average number of atoms)
in each condition. These data show us a picture similar to what happened in
experiment. At 300![]() , 69% of C atoms are in the matrix, which is an indication of
the immobility of C, so the A and B atoms behave quite like in AB binary
system, which can be seen from the small value of ntot and large value of
<natom>. If further annealing at 500
, 69% of C atoms are in the matrix, which is an indication of
the immobility of C, so the A and B atoms behave quite like in AB binary
system, which can be seen from the small value of ntot and large value of
<natom>. If further annealing at 500![]() , there is a significant reduction (more than 19%) of number
of C atoms in the matrix, while a simultaneous increase of B atoms in the
matrix. Therefore, the ratio of number of B atoms in particles and number of C
atoms in particles decreases, i.e. more C in particles, which gives the shift
of the XRD alloy particle peak to tungsten side in experiment. And since there
are more B atoms in the matrix, the number of B atoms that can go to surface increases,
which gives the increase in intensity of Nb peak in XRD profile. If going
directly to 500
, there is a significant reduction (more than 19%) of number
of C atoms in the matrix, while a simultaneous increase of B atoms in the
matrix. Therefore, the ratio of number of B atoms in particles and number of C
atoms in particles decreases, i.e. more C in particles, which gives the shift
of the XRD alloy particle peak to tungsten side in experiment. And since there
are more B atoms in the matrix, the number of B atoms that can go to surface increases,
which gives the increase in intensity of Nb peak in XRD profile. If going
directly to 500![]() , since C atoms start to be mobile, they behave as strong
traps for B atoms, thus giving a sharp reduce in particle size, which is also
shown obviously in XRD profile, i.e. the half-maximum width of alloy particle
peak of annealing at 700
, since C atoms start to be mobile, they behave as strong
traps for B atoms, thus giving a sharp reduce in particle size, which is also
shown obviously in XRD profile, i.e. the half-maximum width of alloy particle
peak of annealing at 700![]() is much smaller than that of either annealing at 600
is much smaller than that of either annealing at 600![]() or annealing first at 600
or annealing first at 600![]() then 700
then 700![]() .
.
- Conclusions
Although our KMC model is quite simple, the results we have are qualitatively in good agreement with experimental observations, providing us with some insights of the atomic scale mechanism. The precipitation size in binary alloys AB will increase drastically without limitation. Just by adding 1 at% of a third element C, which is much less mobile at all temperatures compared with the other solute element B and has a very high heat of mixing with the matrix element A, the precipitation size has been reduced significantly and under control. The mobility of C is the key point to the precipitation process. In general the more immobile C is, the smaller the average size is. But if at a temperature when C is indeed immobile, the material will behave more like binary material, and large precipitates will be formed. The mobility of C is mostly determined by its saddle point energy. One particular saddle point energy is chosen to make C a representation of W in the Cu-Nb-W alloy, and the experiments were re-performed in simulation. Again the mobility of C showed its importance. To make our explanation more convincing, more details need to be considered, and more supportive data are required.
Reference