This work was completed as a class project for MatSE390/Phy398 Atomic Scale Simulations
The most common technique for crystallizing proteins is to dissolve an extremely pure sample of protein in an aqueous solution containing a stabilizing buffer and a precipitant salt. The temperature is then lowered so that the solution becomes supersaturated with respect to the solid phase. On standing, crystallites emerge from the solution. However, in most cases, proteins nucleate very slowly taking days or even weeks to form crystals. An obvious way to increase the nucleation rate would be to quench the solution deeper. However, this results in the formation of gels. An important question therefore arises: When do proteins crystallize, when do they gel? Our aim in this project is to understand this transition through molecular dynamics simulations.
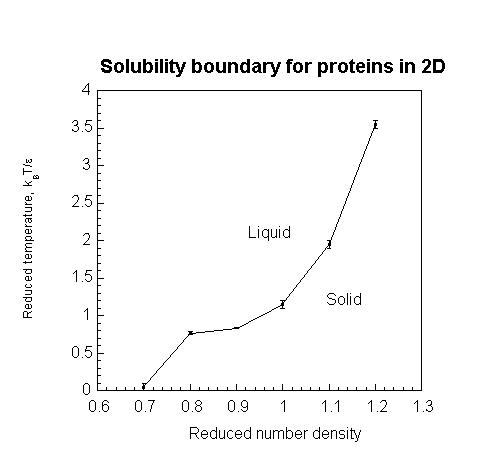
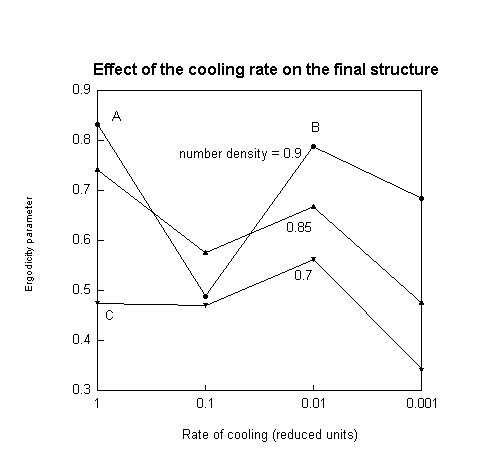
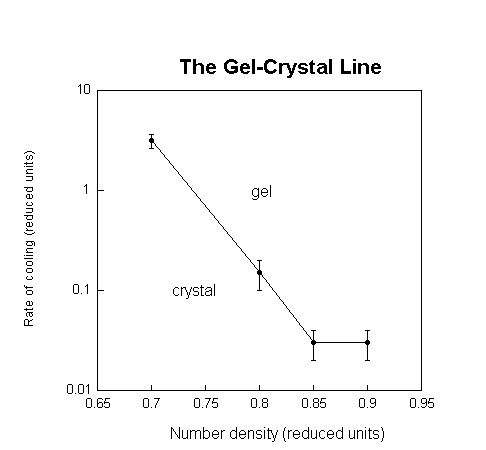
Setting the square well parameters, we first identified the phase boundary using CLAMPS. Then, to determine the effect of the cooling rate on the formation of gels and crystals, we adopted the following procedure. Fixing a volume fraction, we quenched the solution from a fixed temperature above the phase boundary to a fixed temperature below it, varying the cooling rate systematically over several runs. At the end of each run, we determined the state of the solution using two order parameters. Strong peaks in the static structure factor at inverse lattice distances indicated a solid state. To distinguish between a liquid and a gel, we used the non-ergodicity parameter, also known as the Debye-Waller factor or the Edwards-Anderson parameter. A non-zero value of this parameter indicated a gel. We repeated this procedure for a range of volume fractions. The variation of the critical cooling rate at which the transition between forming gels and forming crystals occured is shown as a function of the protein volume fraction resulting in what we call a gel-crystal line.
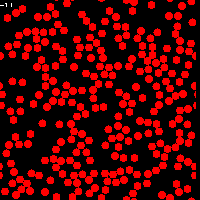
Analyzer was employed to provide the stucture factor of the resulting configuration, and atomviewer was used to visually inspect the simulation. A few sample view graphs are given here.
I. Design Requirements
In order to locate the gel-crystal line, it was necessary to do a number of
simulations of model colloidal systems. To this end, our group produced a molecular
dynamics code that was tailored to our specific needs. We designed the code to fulfill the
following requirements:
The code needed to simulate a large number of particles in a
reasonable
amount of time so that gelation could be identified.
The temperature of the system needed to be precisely controllable so that the
rate of temperature change could be specified as parameter of the
simulation.
II. Algorithm
The nature of colloidal suspensions, that is, large particles with deep but short range, square well, interactive potentials, allowed us to meet our first requirement with relative ease. We modified the traditional hard sphere algorithm by adding a potential well boundary a short distance from the hard sphere potential barrier. Collision times could then be calculated for three distinct cases: a particle entering a well (a collision between a particle and another particle's potential well boundary), a particle colliding with a particle or a particle leaving a well (a collision between a particle and another particle’s potential well boundary while the particles were moving apart). The slight overhead of checking particle distances and relative velocities prior to calculating the collision time allows only one case to be checked per particle pair. Consequently, the computational complexity is negligibly influenced by the addition of the second boundary. The central component of the hard sphere algorithm, wherein the next collision is executed and then the list of future collisions is updated, remains largely identical to the traditional O(n) method. However, in the interest of reducing total memory requirements, a number of arrays were replaced by a linked list structure.
Pursuant to satisfying our second design requirement, a framework for re-scaling the particle velocities was added. Though we considered several methods for controlling the temperature, the most efficient method was to quench the system every time the system was updated. Though, this has the unfortunate effect of discreetising the temperature inn time. Order of magnitude estimates of the error induced by this simplification indicate that it is by and far the best solution. Other methods required the solution of complicated differential equations each time the system was updated and were resultantly rejected because their effect on the simulation’s running time would have been unreasonable.
The application itself was written in C++ for organizational reasons. It is worth noting however, that in several instances, object oriented design principles were blatantly disregarded in an attempt to reduce the number of overhead function calls. No memory management was explicitly done, though one perk of having relatively small memory requirements was that both spatial and temporal locality are high. All the data can easily be kept handy in the second level cache if not the primary cache.
III. Simulation Outline
Though the simulation had a veriety of parameters, including the initial and final temperature, the rate of temperature change and the number density, each run followed essentially the same outline.
1. Initialization -– The particles were placed on a grid within the periodic boundary conditions. Box dimensions and particle numbers were selected so that there was no particle overlap in the initial configuration. Each particle was then given a random velocity selected from a Gaussian distribution. After all the particles had a velocity, the velocities were scaled to conform to the initial temperature condition.
2. Thermalization - The system was allowed to thermalize, while kept at the initial temperature. Structure factors were checked after the thermilization process to ensure that the system was indeed above the phase boundary predicted by CLAMPS.
3. Quench - The system was cooled at the rate specified. This section of the simulation ended as soon as the system’s temperature went below the lower temperature bound.
4. Record Configuration – The system was run at the lower temperature while configurations were periodically recorded for later analysis.
5. Thermalization – The system was allowed to thermalize at the lower temperature. Thermalization proceeded for 50 reduced unit time steps. This time was sufficient for the system to rearrange itself if it could.
6. Record Configuration – The system was run at the lower temperature while configurations were periodically recorded for later analysis.
After the simulation was complete, the data from steps 4 and 6 was used to calculate structure factors and the ergodicity parameter.
An Introduction to Protein Crystallization
Molecular Simulation of the Crystallization of Organic Materials
Hino, T., Prausnitz, J. Solid-liquid Equilibria for Solutions of Binary Globular-Protein Mixtures AICHE Journal v.45 no3, March 1999, pp.622-32
Hsu, J., Liu, B. Critical Coagulation Concentration of a Colloidal Suspension at High Particle Concentrations Journal of Physical Chemistry v.102, January 8, 1998 pp. 334-7
Kallala, M., Jullien, R., Cabane, B. Crossover from Gelation to Precipitation Journal of Physics II France 2, January 1992. pp.7-25.
Stauffer, D., Coniglio, A., Adam, M. Gelation and Critical Phenomena Advances in Polymer Science 1982 pp.105-158
Verduin, H., Dhont, J. Phase Diagram of a Model Adhesive Hard-Shpere Dispersion Journal of Colloid and Interface Science 1995 vol. 172 pp.425-437
Verheul, M., et al. Power Law Behavior of Structural Properties of Protein Gels Langmuir 1998 vol.14 pp.2263-2268